The Solutions Project (TSP) is a national nonprofit that supports climate justice leaders and organizations on the frontlines of the movement. They combine grantmaking, storytelling, and amplifying media to resource communities of color and women-led organizations who are building equitable solutions to the climate crisis.
By shifting funding and visibility to grassroots leaders, they help ensure that the voices of those most impacted are centered in shaping a just and regenerative future.
My Role
Lead Designer, Wire Media
Team
Marcy Rye, CEO, Wire Media
Ruwantha Weddikkara, Project Manager, Wire Media
Dylan Tuohy, Web Developer, Wire Media
Leslie Cain, Consultant
Kathryn Destin, Copy Editor
Project Scope
Branding
UX/UI Design
Client Type
Climate Justice Nonprofit
Key Features
Custom Layout Design
Data Visualization
Supporting-PDF for Donors
Social Media Templates
Jump to Section:
Project Goals | Process & Approach | Competitive Research | UX & Visual Design | Results
Laying the Groundwork
Project Goals
Shape and Elevate the Story
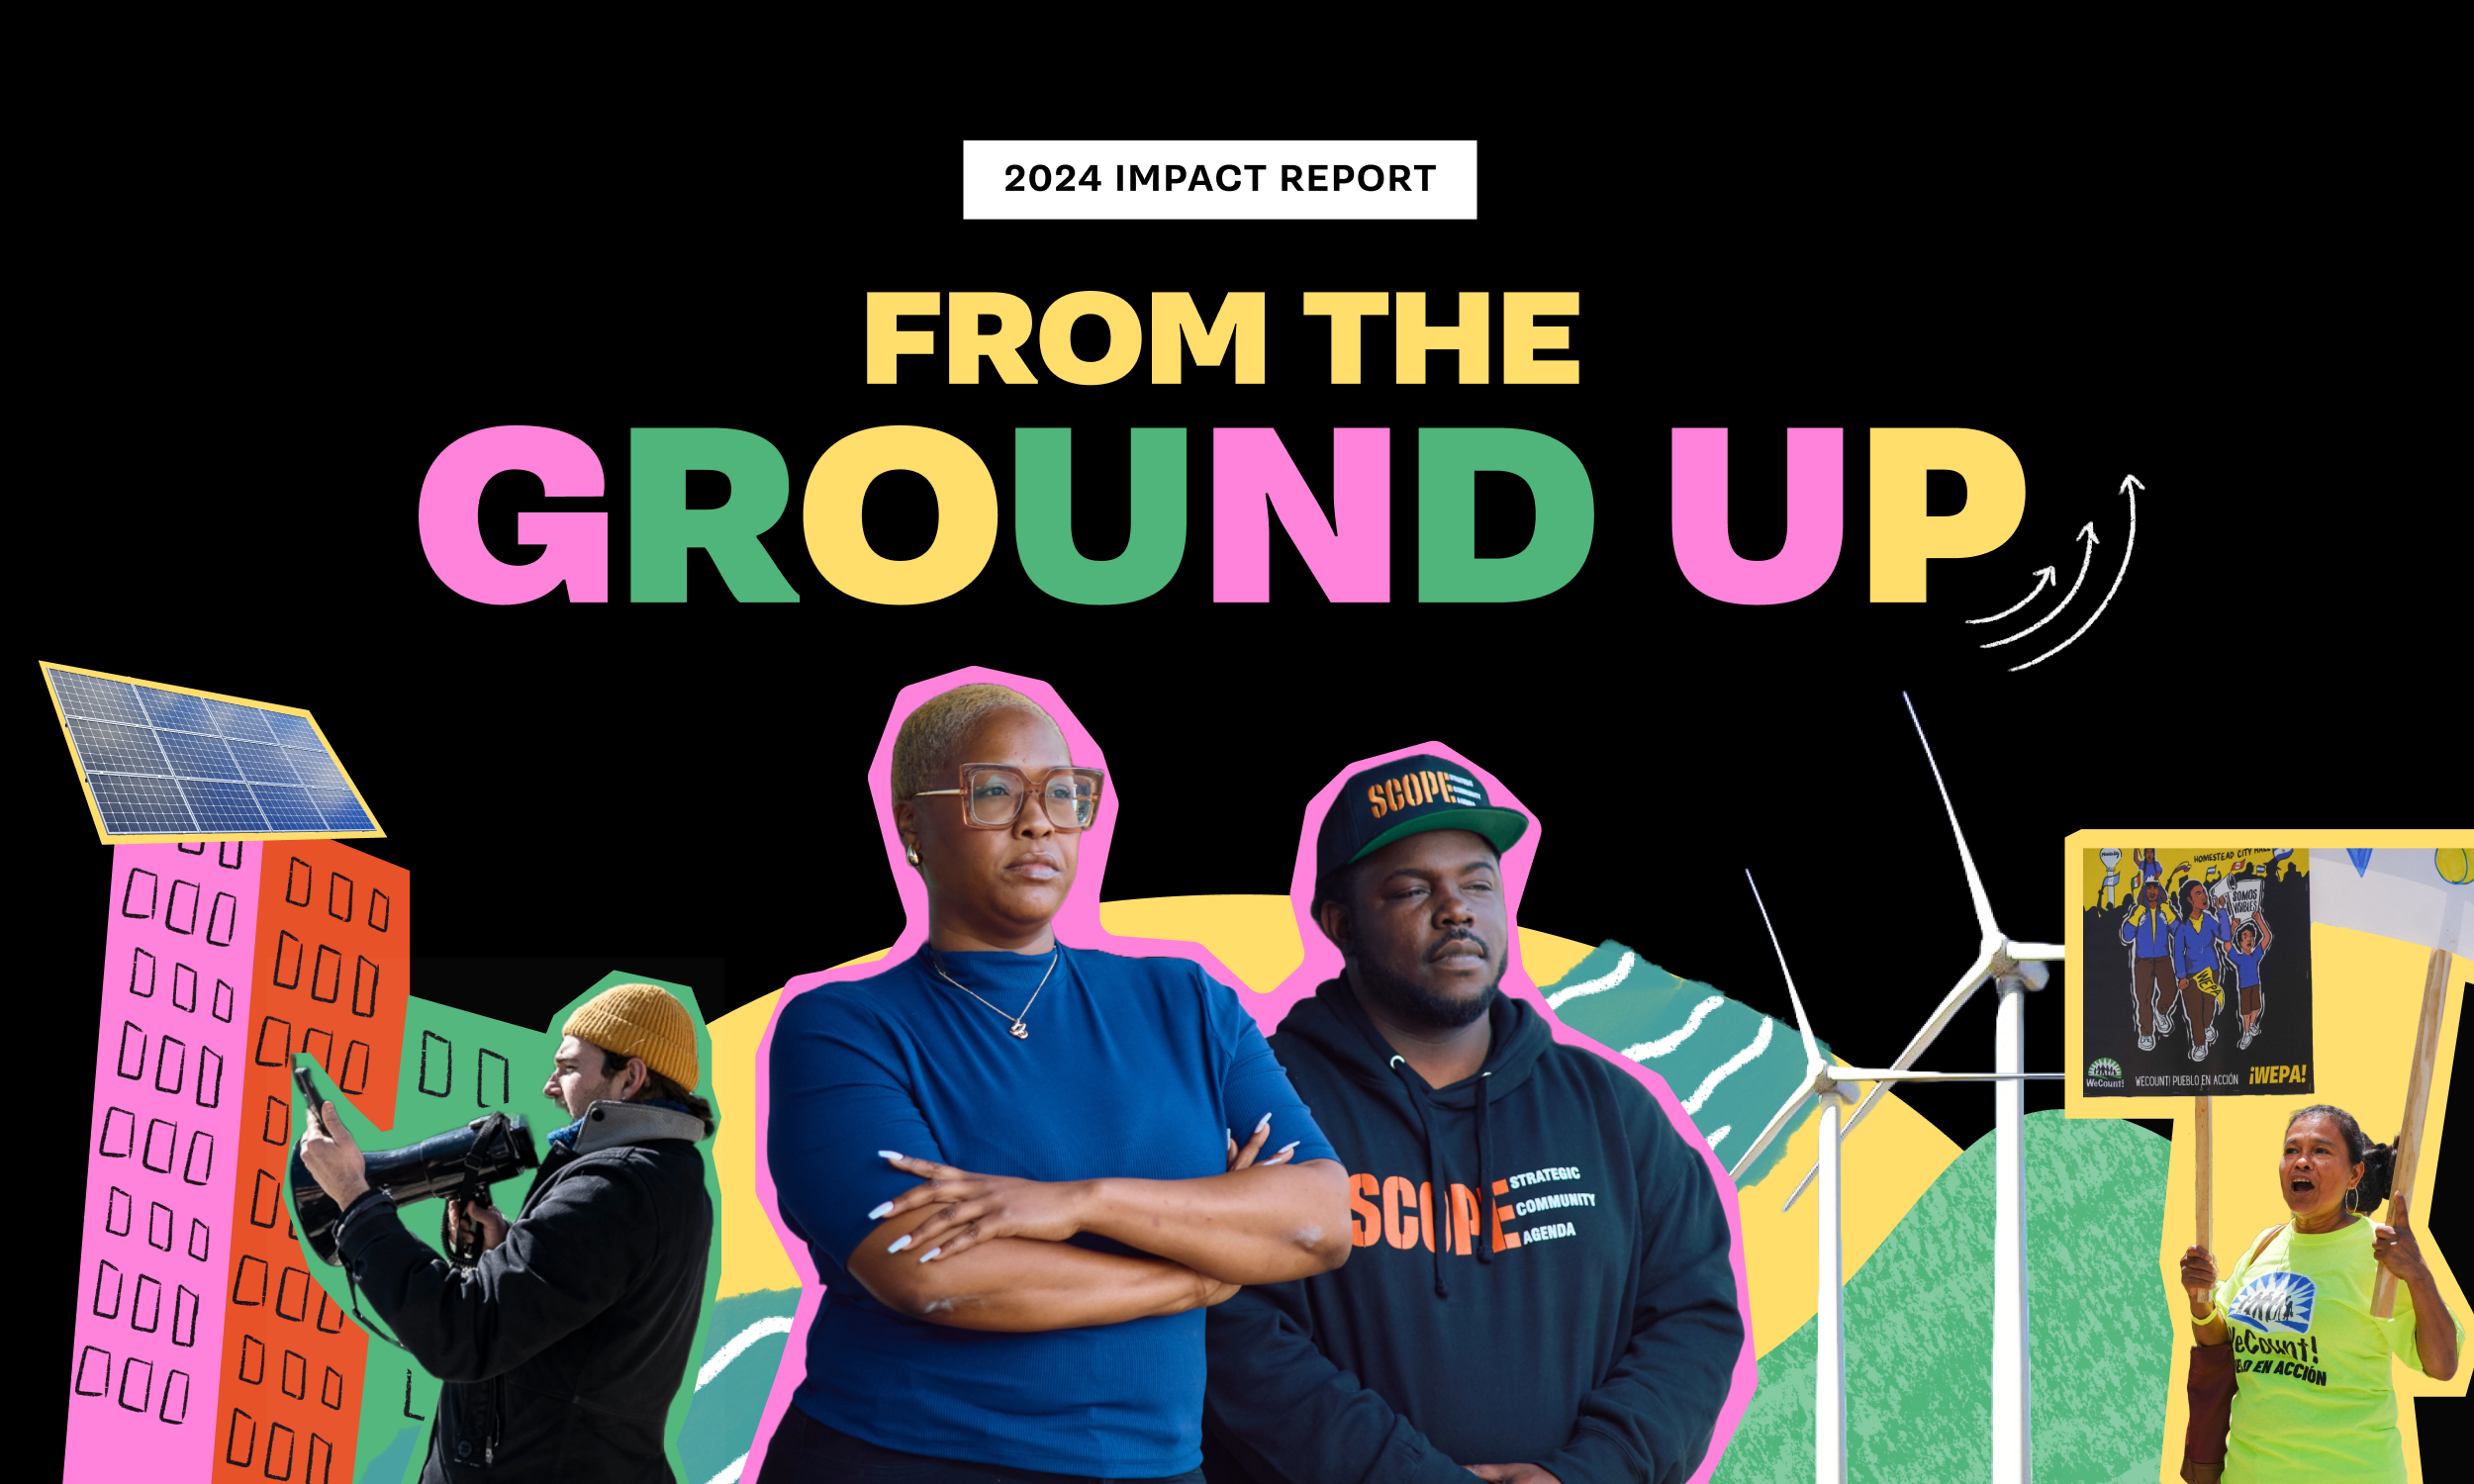
Support The Solutions Project in refining their draft copy and ideas into a polished, easy-to-read report, while ensuring the content clearly communicates the 2024 theme “From the Ground Up” and is reinforced by compelling storytelling.Blend Theme and Design Seamlessly
Use the theme as a creative throughline for both content and visual design. Explore metaphors such as growth, networks, or organic structures, and push brand boundaries with fresh elements like cutout imagery, textured overlays, hand-drawn accents, and meaningful photography or illustrations that deepen context rather than decorate.Design for Engagement and Ease
Create a user-friendly experience that reduces friction, minimizes unnecessary clicks, and strategically incorporates interactivity through animations, transitions, and collapsible content. Prioritize a design system that translates seamlessly across devices, making the report both impactful and accessible.

Refining Through an Iterative Approach
Process & Approach
The Wire Media team & I worked in a structured, sprint-based process to bring The Solutions Project’s 2024 Impact Report to life.
Working in one-week sprints, our team moved from discovery and content development through UX, design, and development, with continuous reviews to keep the project aligned with TSP’s vision.
This phased approach ensured we could balance creativity with precision, building a polished, engaging digital report on time for launch.
-
Together with key stakeholder from The Solutions Project team, we defined project goals, identified the annual theme, and created a high-level outline through a collaborative kick-off and discovery process.
-
In the content development phase, I worked with our consultant and copy editor to build the content framework.
At every stage of the project, I made sure that the evolving content adapted well with the UX & visual design. I refined each section with multiple review touchpoints from TSP’s leadership and partners.
-
I developed wireframes in iterative rounds, incorporating feedback to align structure, storytelling, and copy direction before moving into visual design.
-
We began the visual design process with moodboards and an initial hero image that set the tone for the art direction and reflected the year’s theme.
Once the direction was approved, I designed the full digital experience across multiple rounds, blending strong collage & hand drawn imagery with data storytelling.
Iterations culminated in an approved design system and finalized specs to hand off to our web developer.
-
After development was complete and before launch, we conducted a thorough quality assurance process to ensure the impact report functioned smoothly across devices and browsers.
We provided the Solutions Project team with a user testing guide to support internal review, gathered feedback on usability and performance, and implemented any necessary design updates or bug fixes.
This final phase helped confirm the impact report was stable, accessible, and aligned with project goals.
-
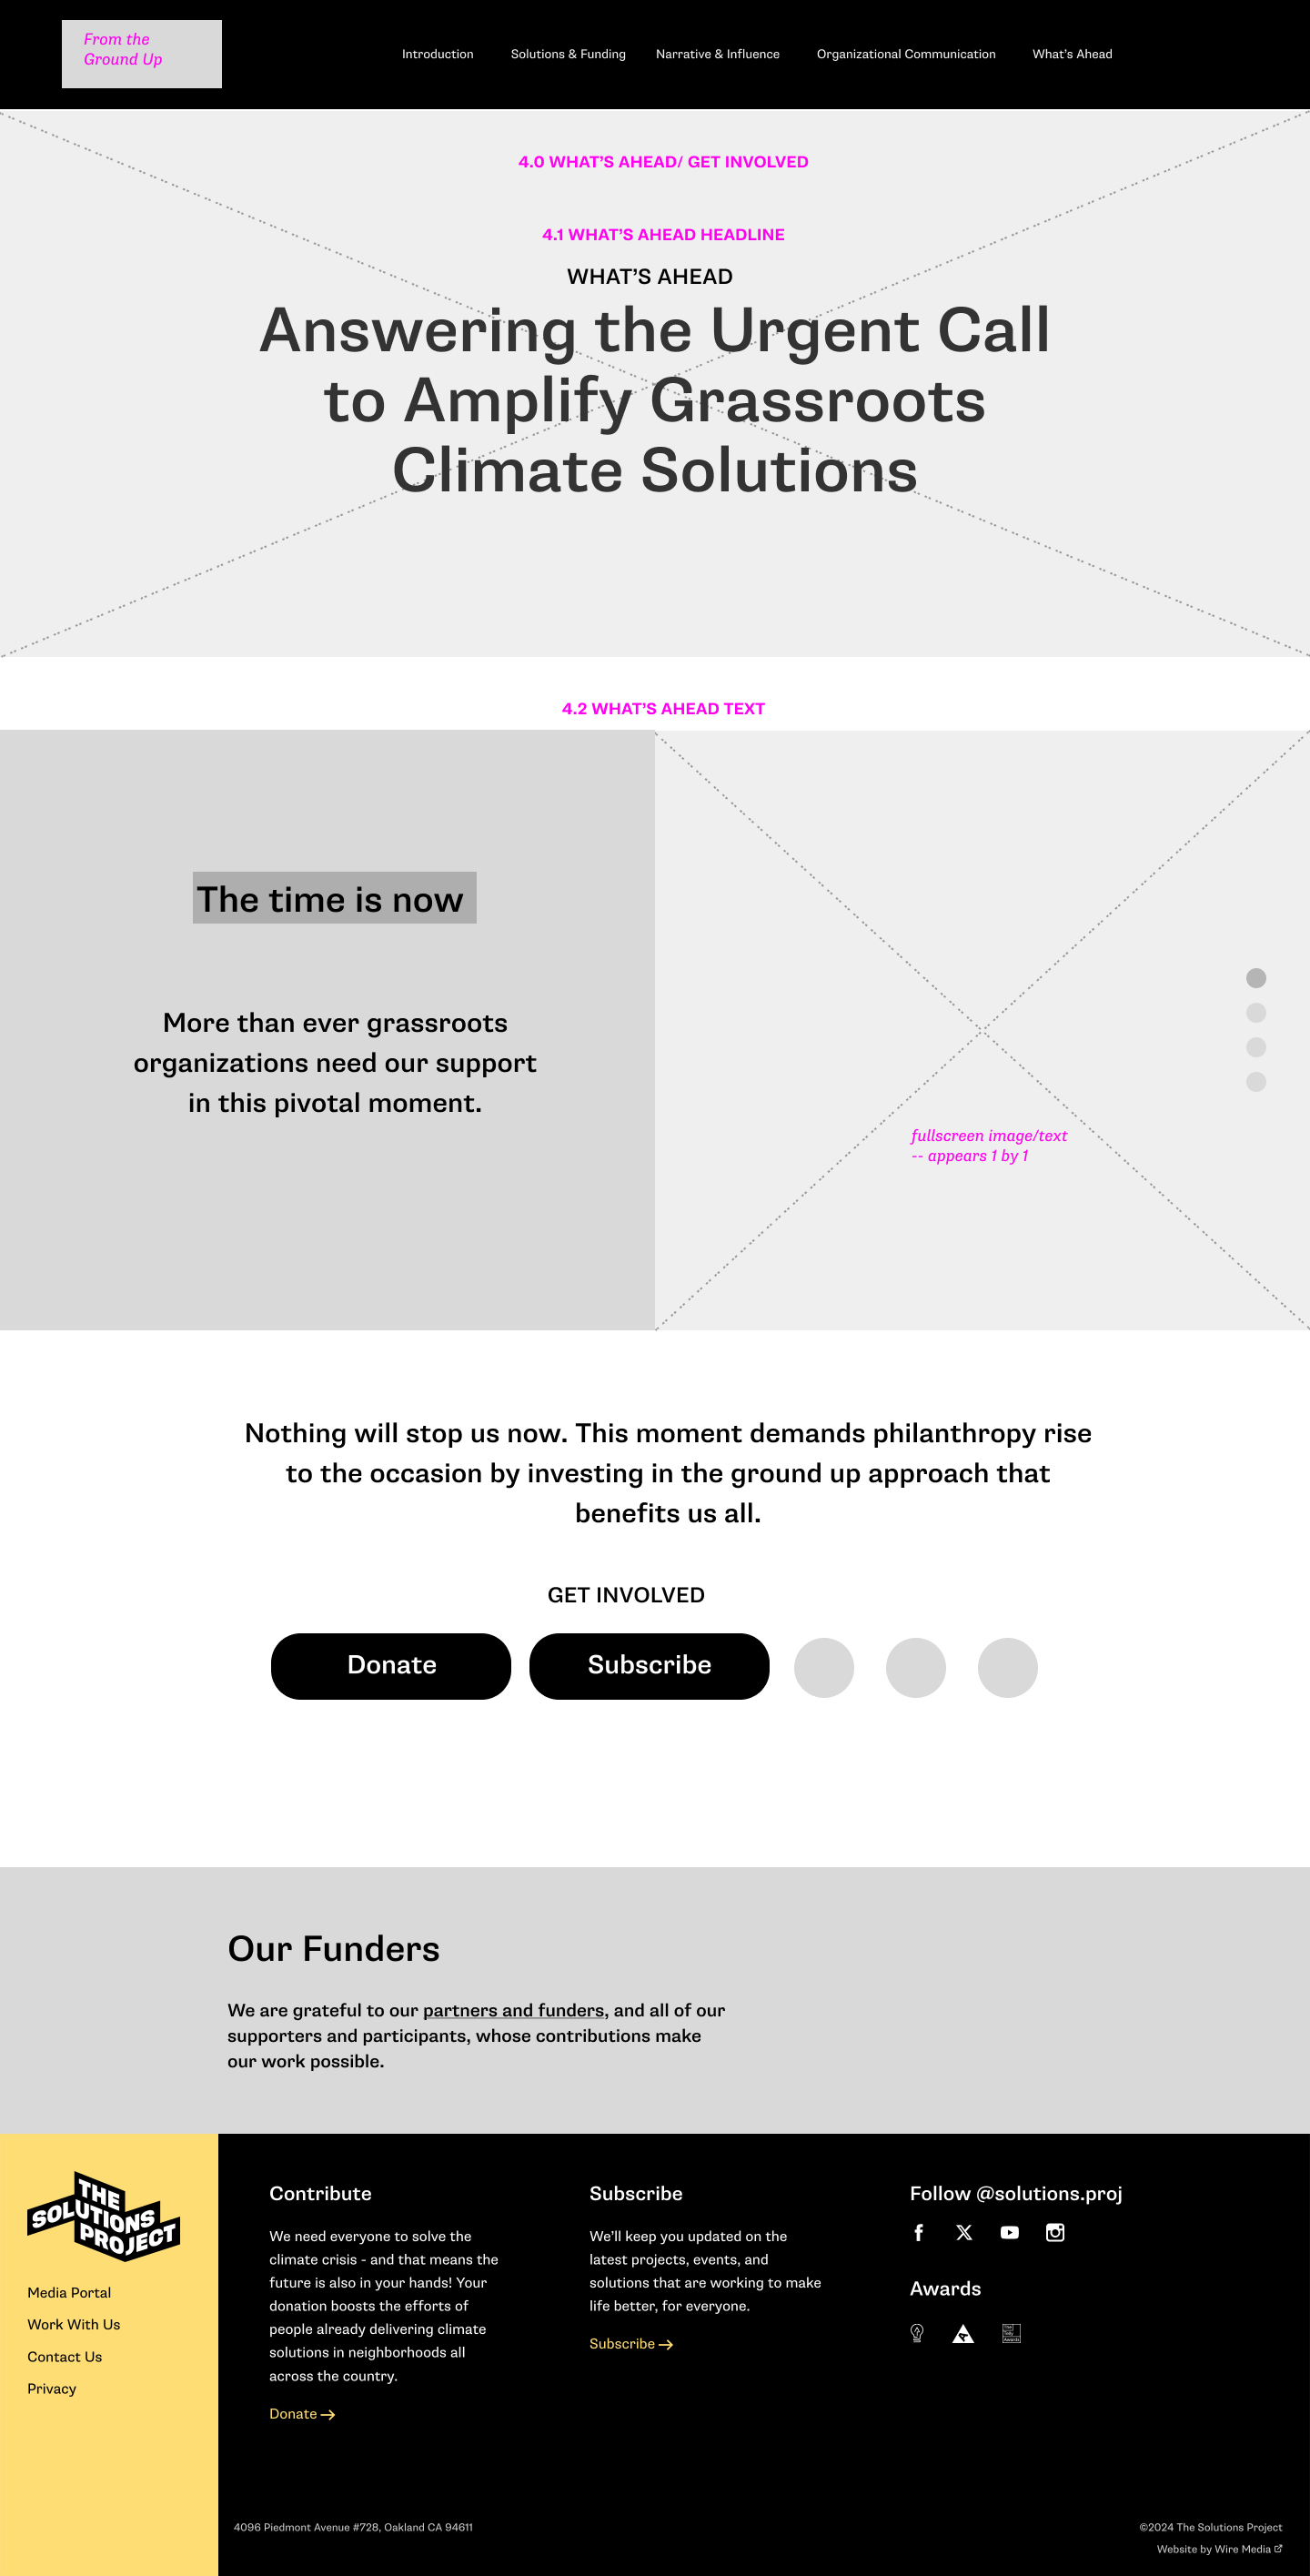
After QA testing, I created a consolidated PDF version of the report tailored for donor audiences, ensuring it was easy to share and reference.
In parallel, I designed ready-to-use social media templates, giving the communications team a flexible toolkit to promote the report across platforms with consistent branding and visual impact.
Harvesting Insights, Growing Impact
Competitive Research
I conducted competitive research on 15 impact/annual reports across climate, philanthropy, and tech to inform our UX decisions for TSP’s 2024 report.
Focusing on interaction design, data visualization, narrative structure, and mobile usability, I identified patterns that support a “From the Ground Up” experience; clear chapters, purposeful motion, and scannable stories, then translated those into concrete design choices for The Solutions Project.
Here are some key insights from that research:
-
We saw the strongest reports use simple scrolling experiences with anchor navigation and progress cues.
For The Solutions Project, we designed a scroll-first layout with optional deep dives, making the report easier to explore without extra clicks.
-
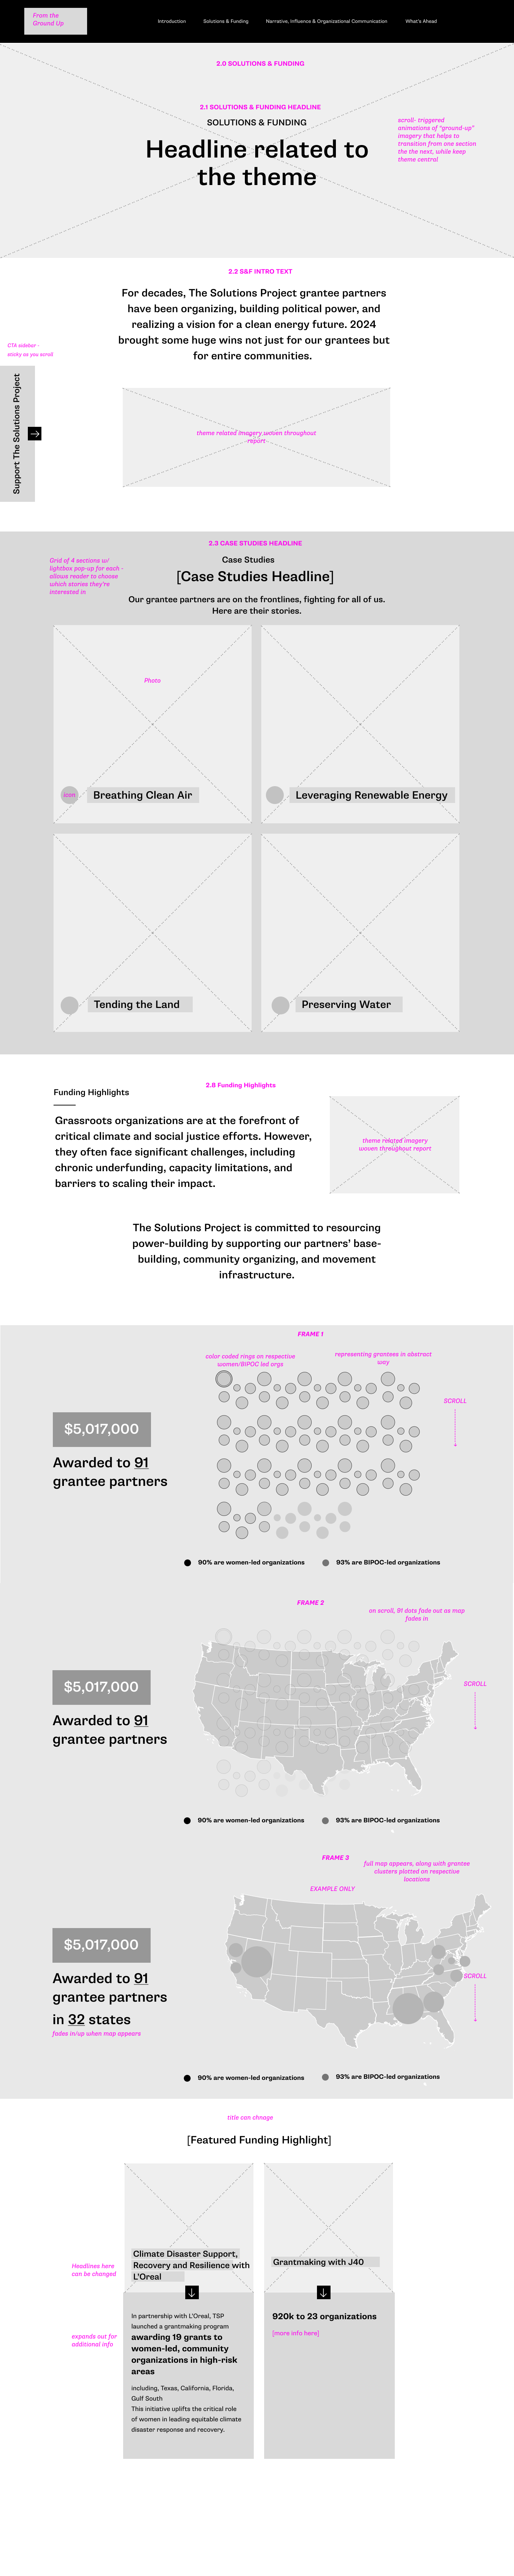
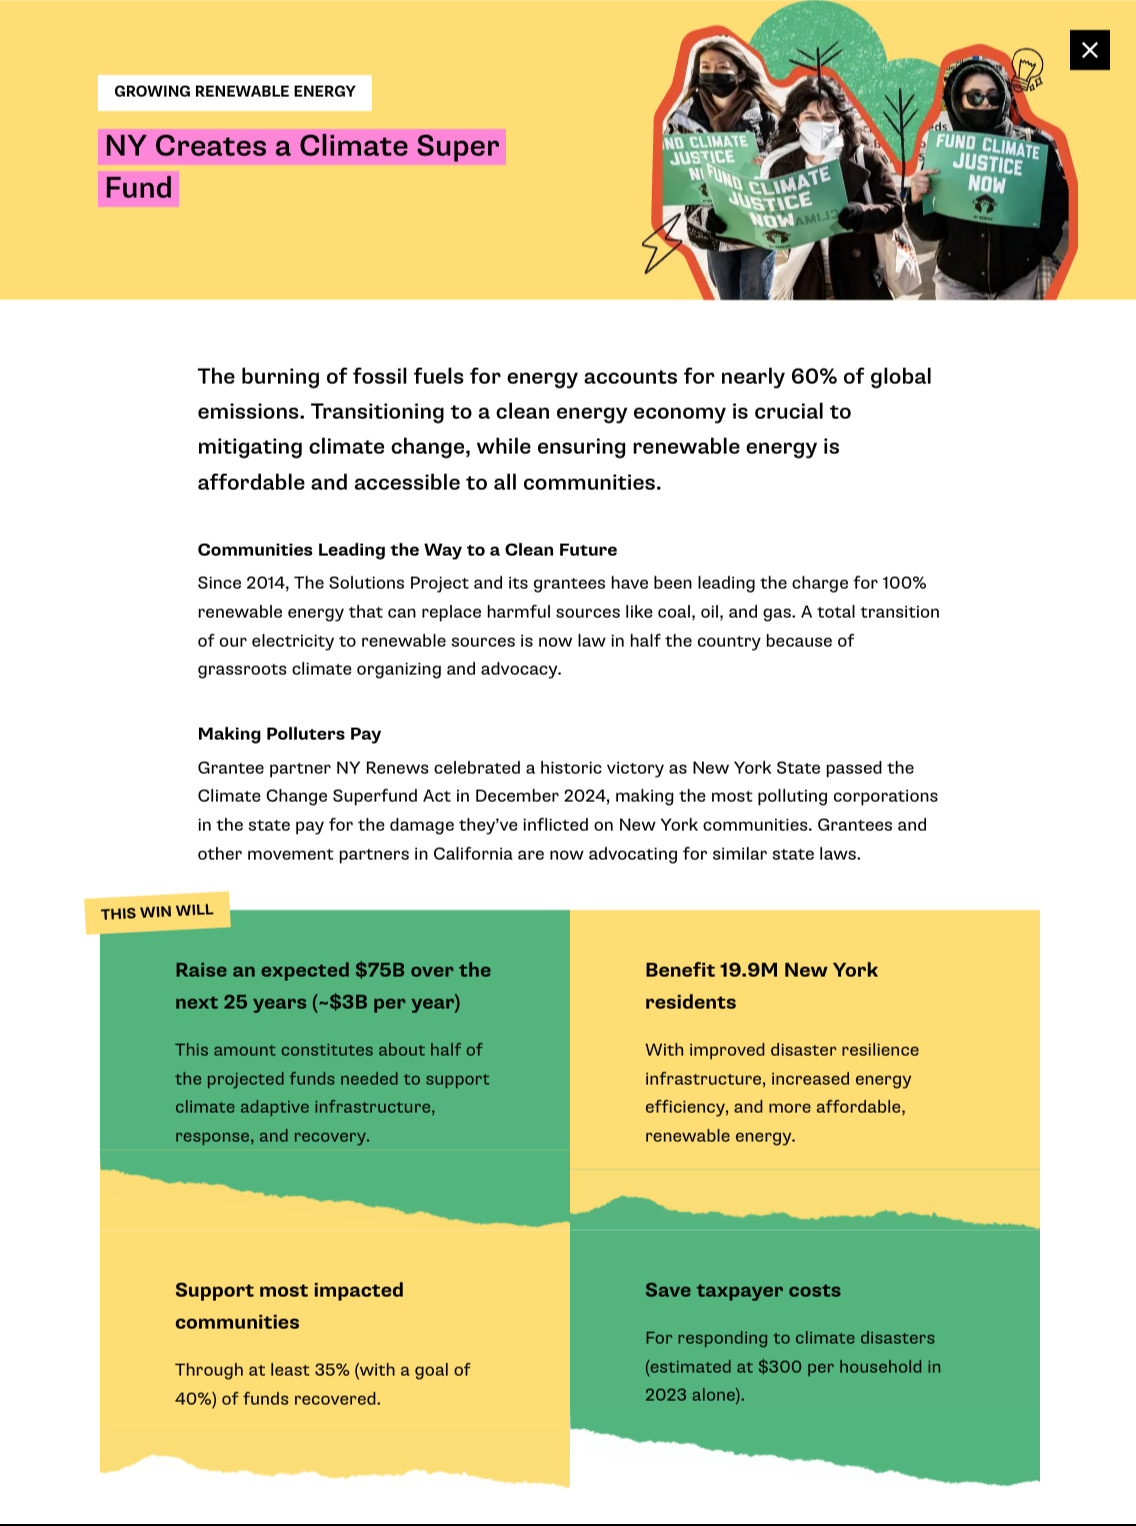
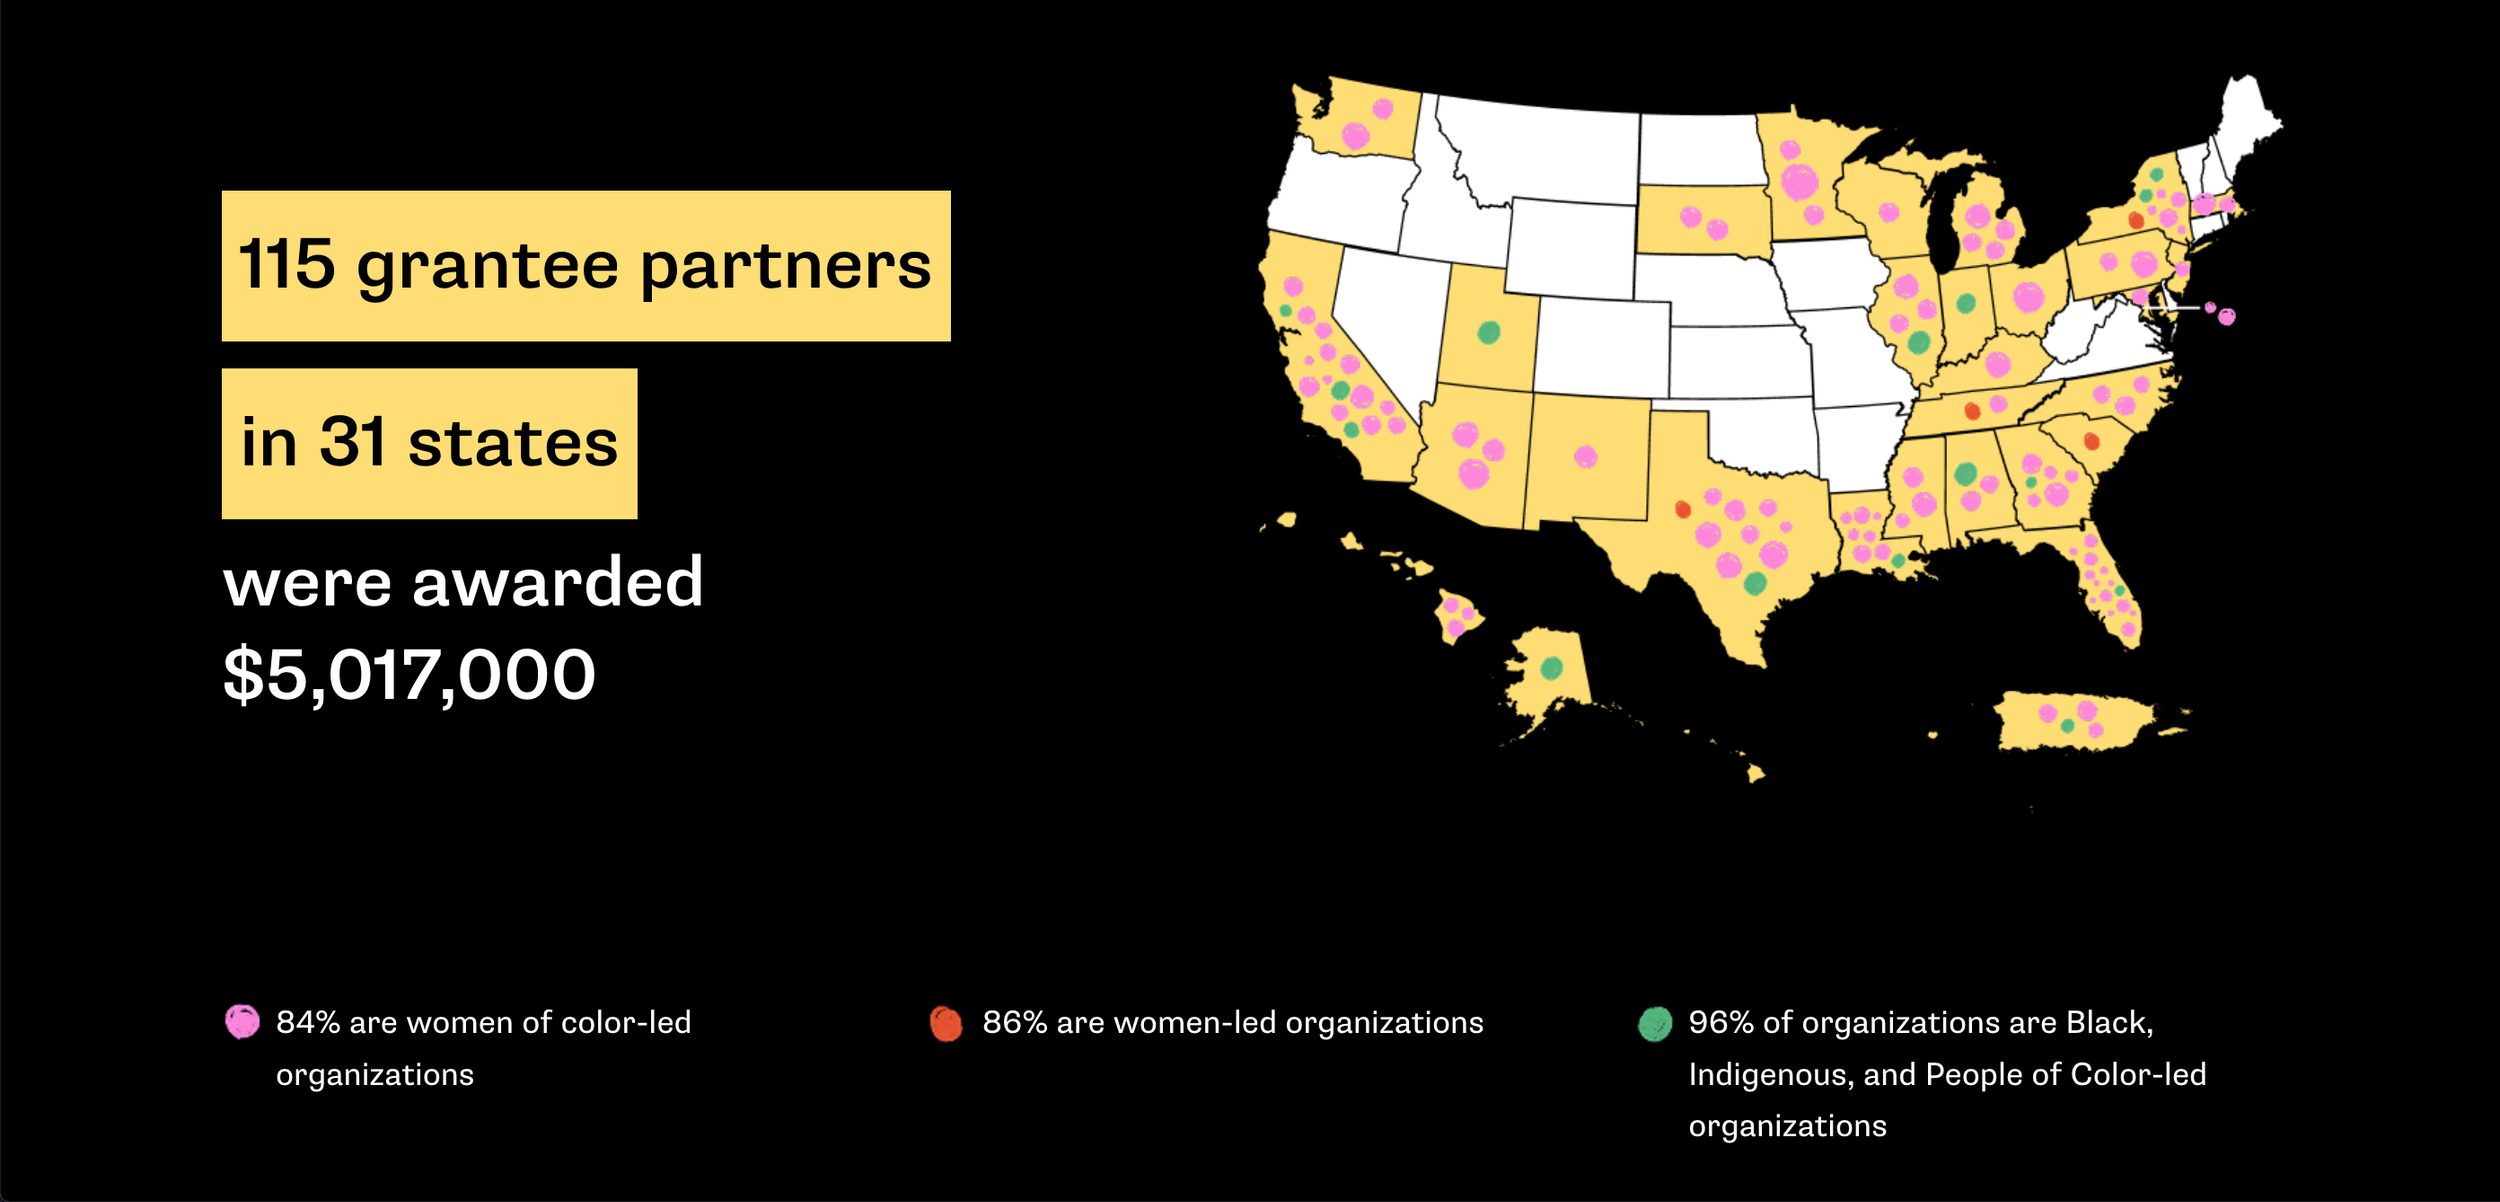
Reports that used clean, purposeful data visualization built trust, while decorative graphics often confused the story.
I created a simple data-viz system with consistent imagery, legends, and captions to keep TSP’s data clear and impactful.
-
The best reports were mobile-friendly, with single-column layouts and collapsible content.
We prioritized mobile readability and collapsible sections and added subtle transitions.

Planting the Seeds for Readers
UX Design & Wireframes
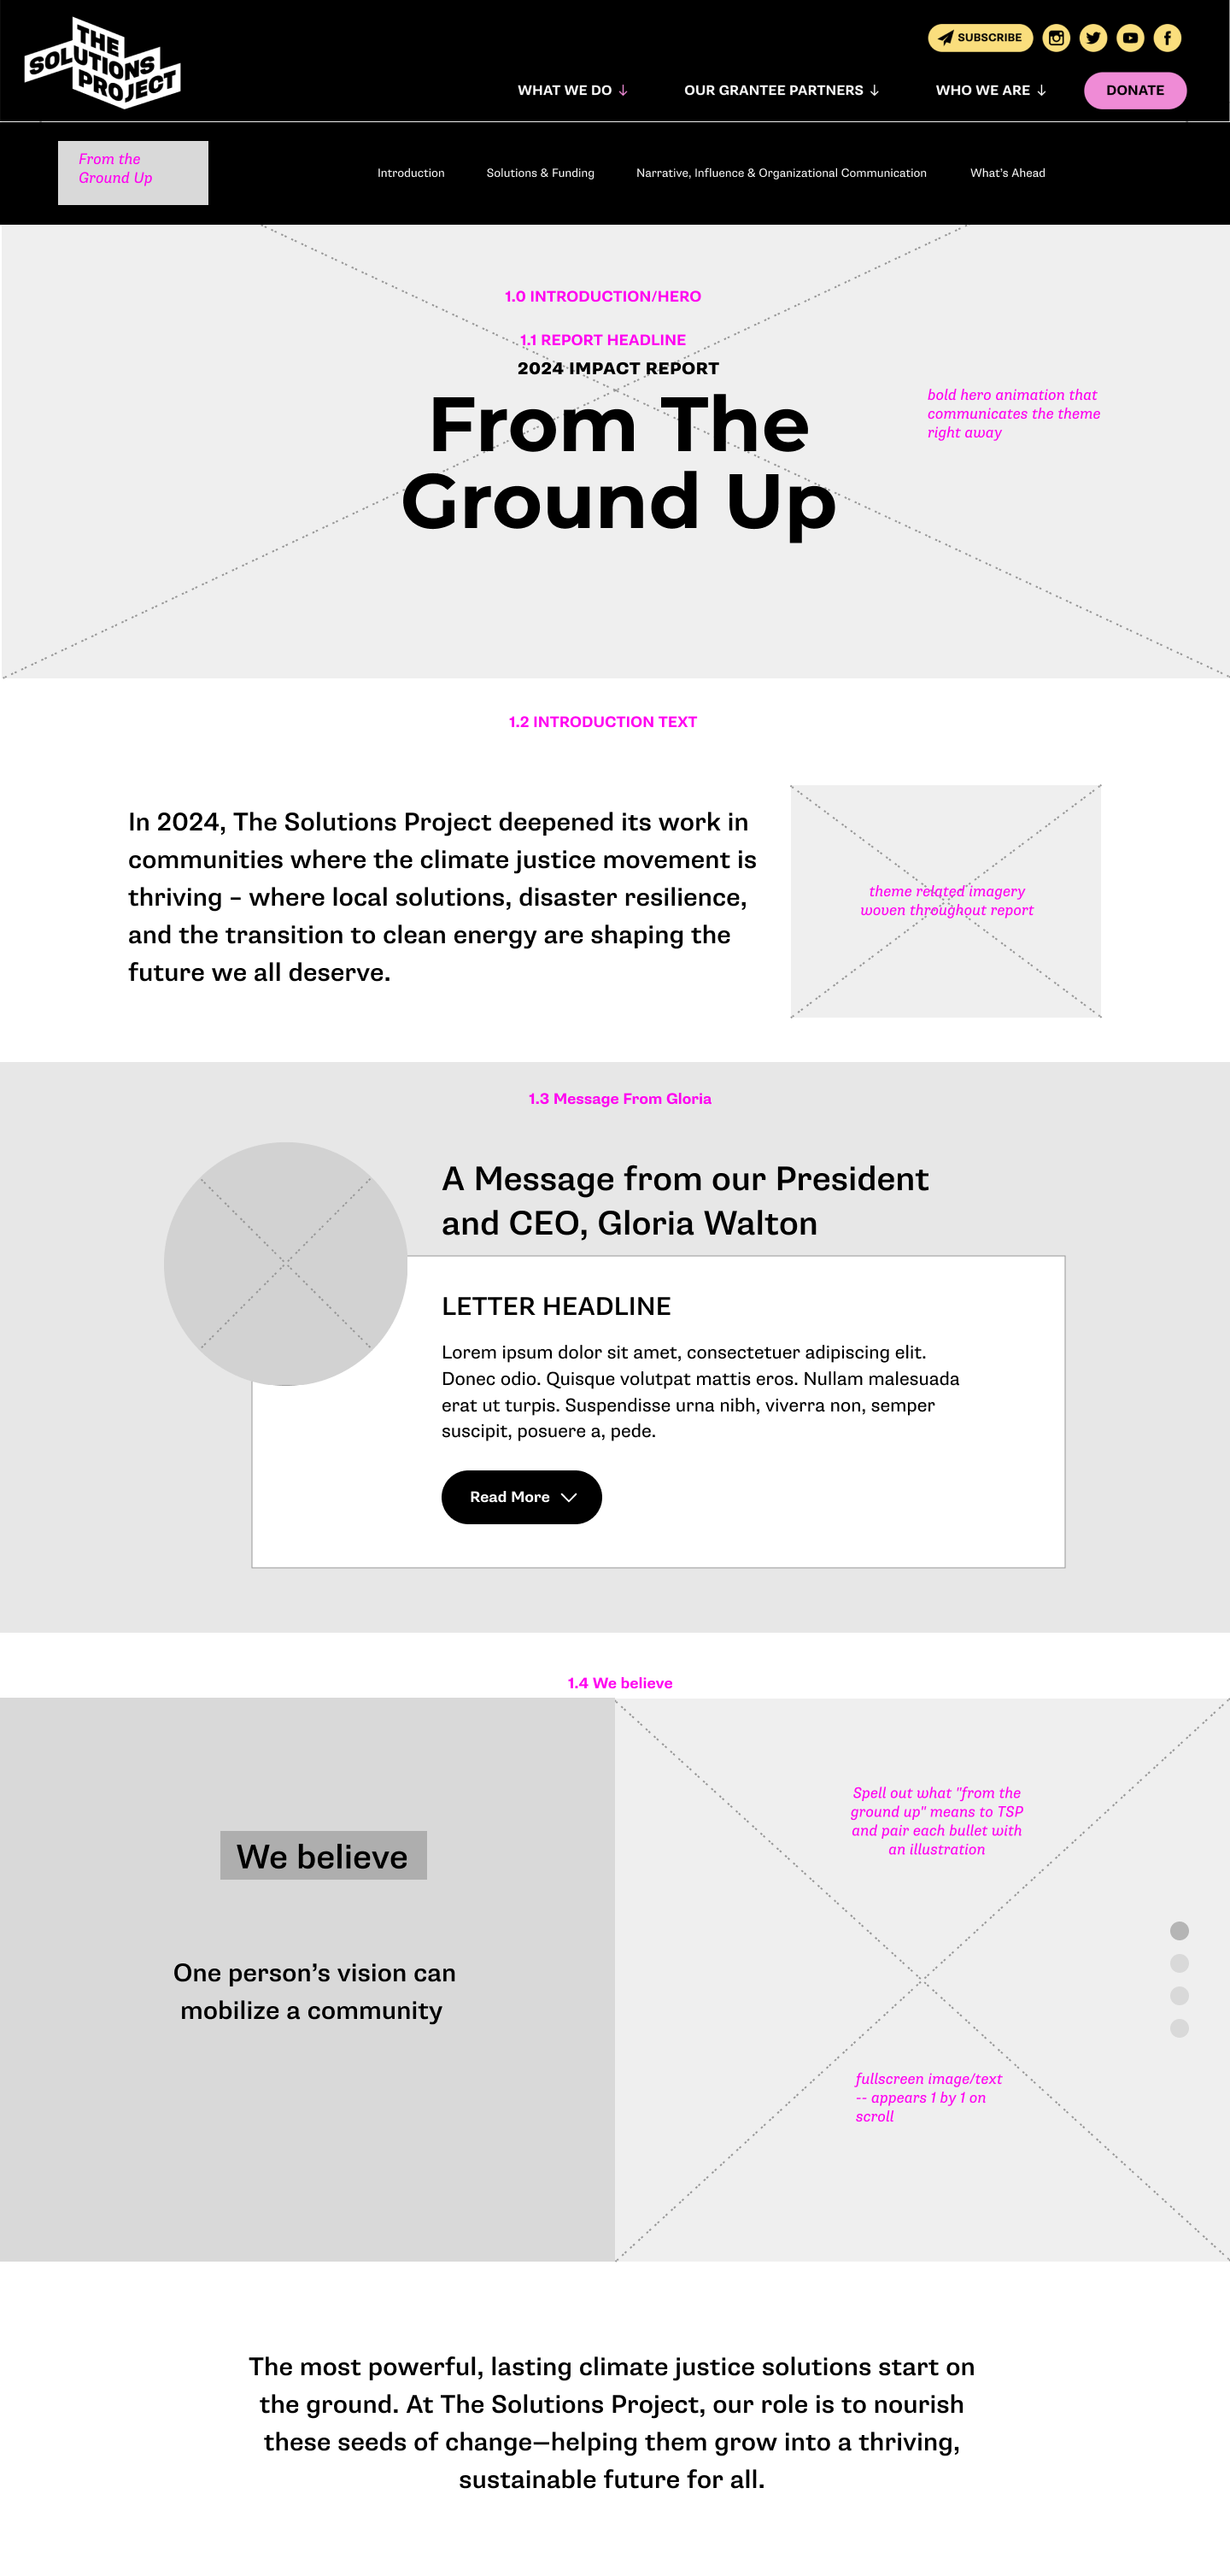
I designed the user flow and wireframes to balance clarity, interactivity, and storytelling, making the report easy to navigate while leaving space for content and visuals to evolve together.
The wireframes were built with the following considerations:
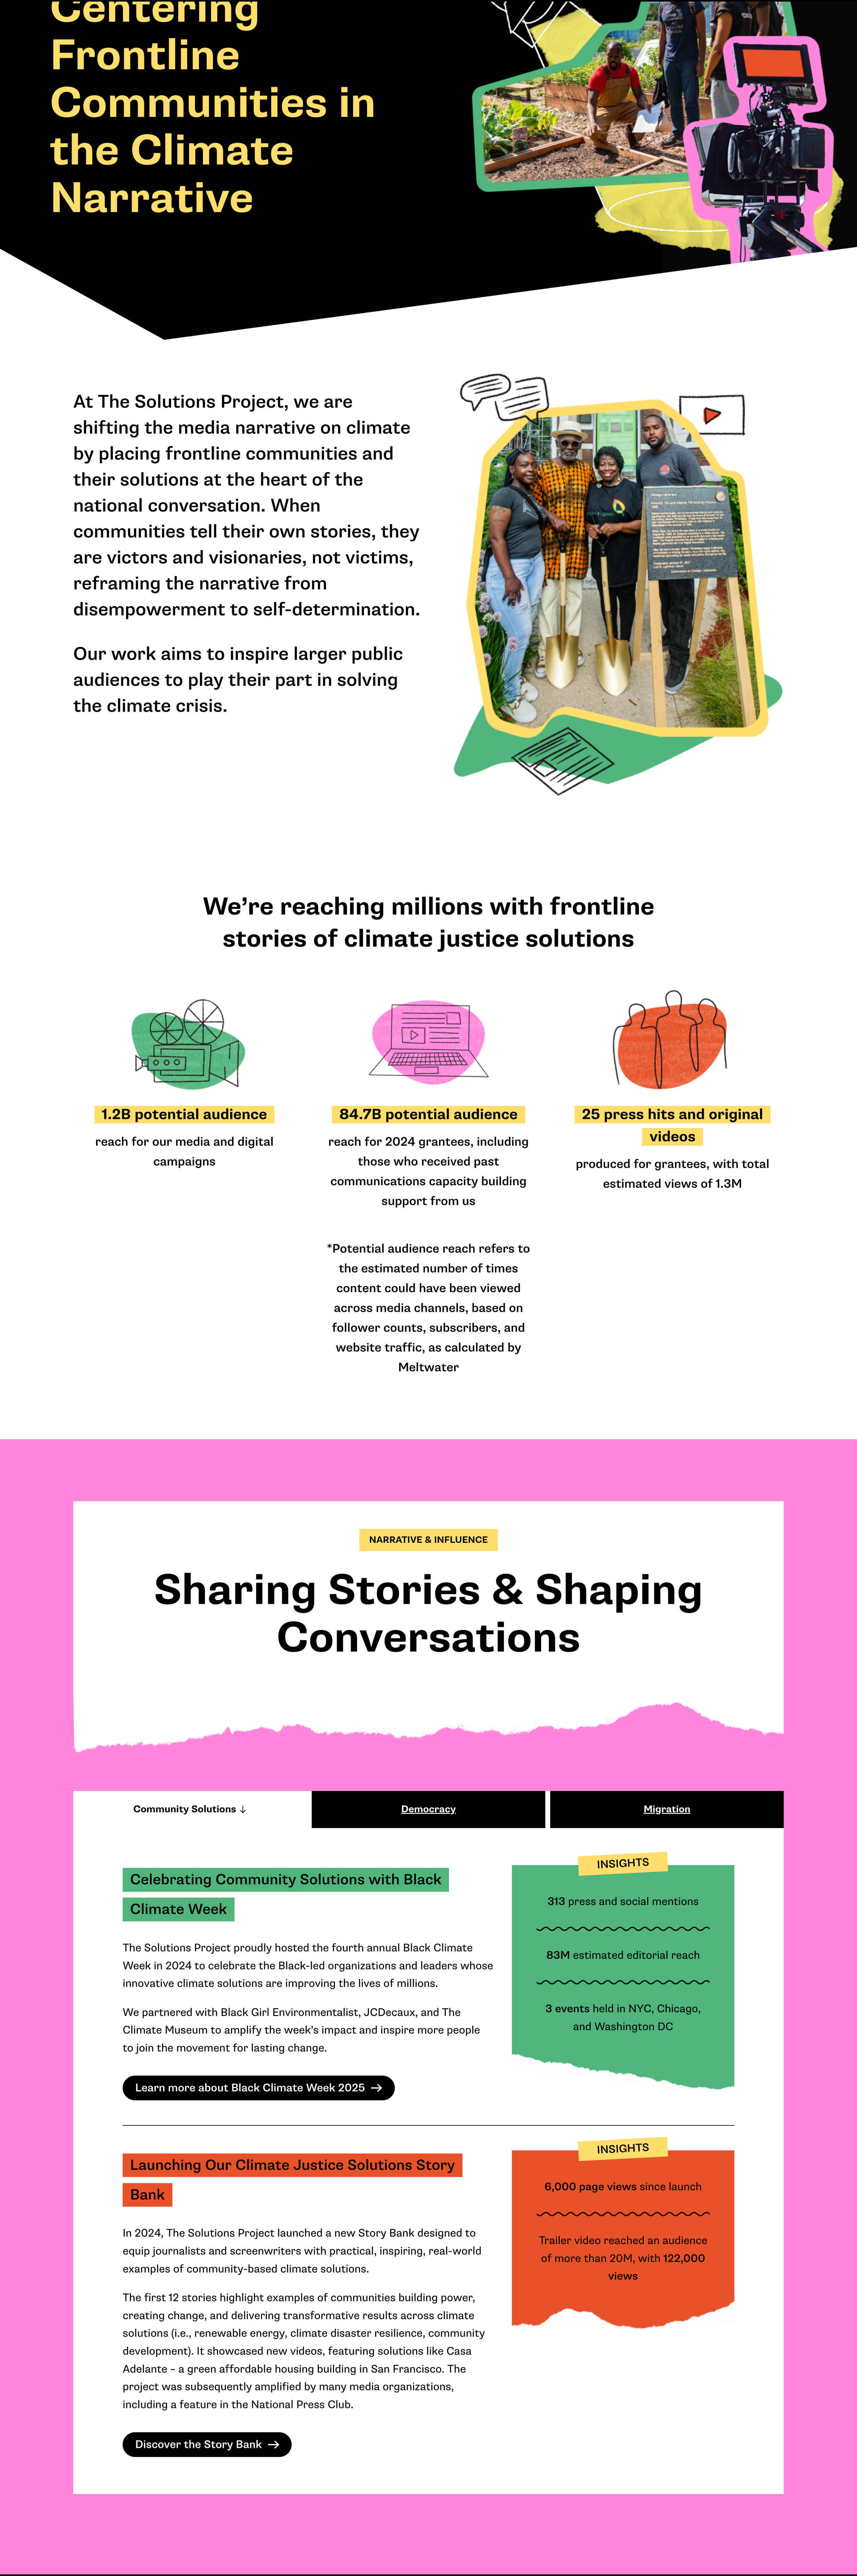
Structure the report into four main sections—Introduction, Solutions & Funding, Narrative & Influence, and What’s Ahead. These sections maintained consistency with past years while ensuring clarity for readers.
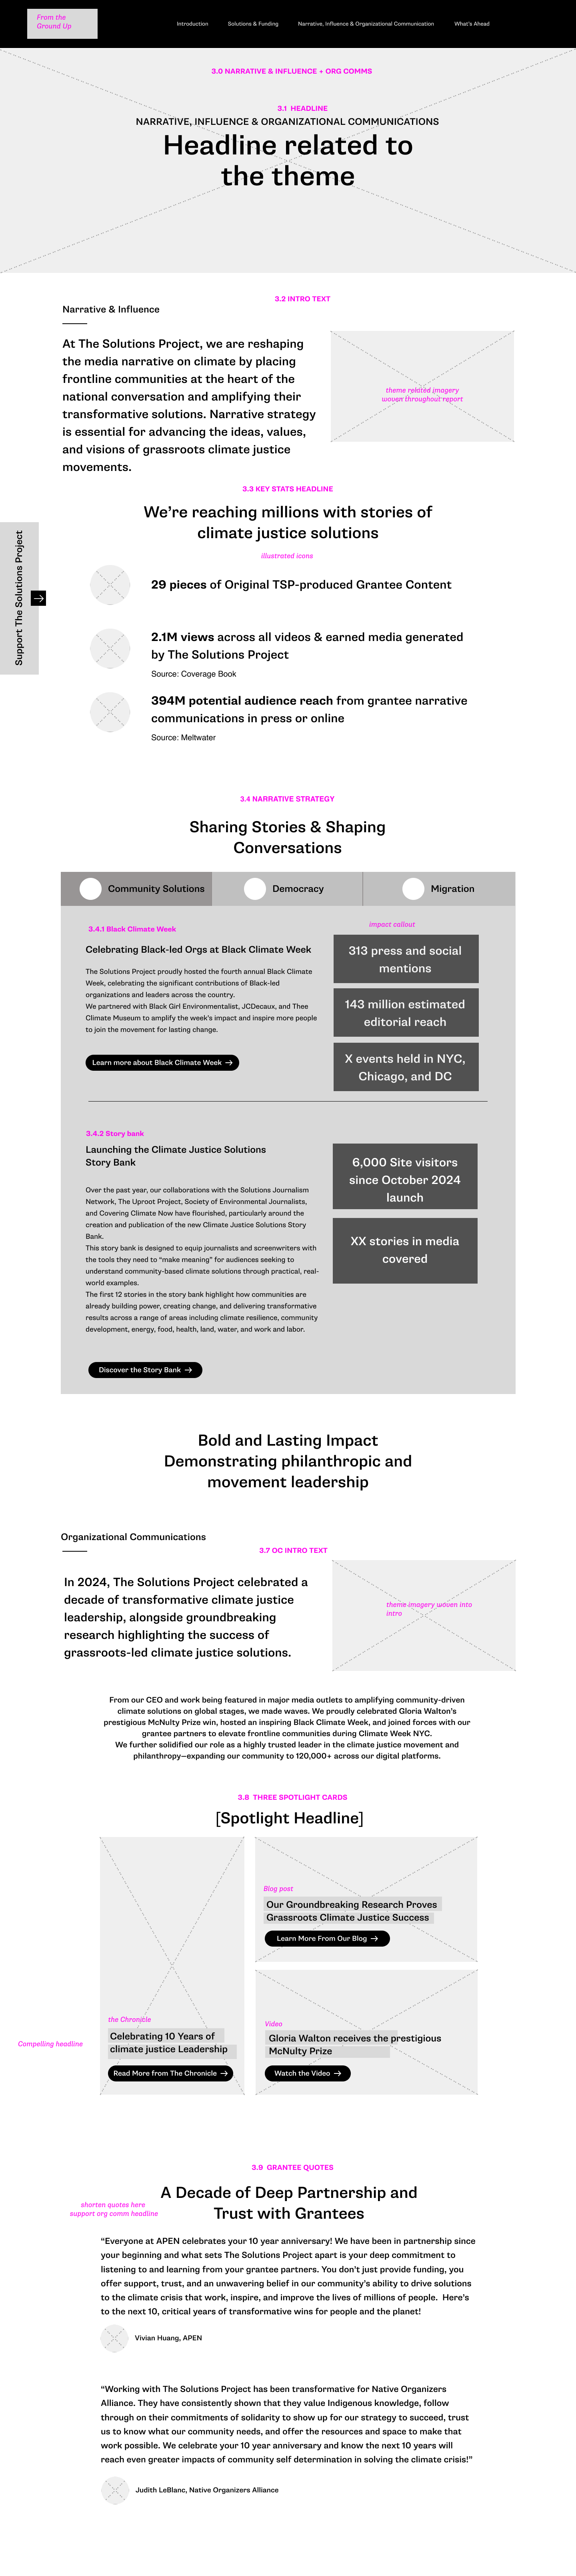
Recommended light interactivity (map, simple data visualizations, and layered content) so that readers skimming the report could grasp key insights quickly, with the option to click into UI elements for deeper exploration.
Prioritized ease of use by minimizing clicks, focusing interactivity on high-value areas, and enhancing the experience with passive interactions like animations and transitions.
Build wireframes in parallel with ongoing content development, setting up touchpoints with the client and copy editor to align structure and copy so that the narrative flowed seamlessly across sections.
Design layouts that left dedicated space for illustrations and visuals tied to the annual theme, allowing imagery to enrich the storytelling without overwhelming the content.

Expanding the Roots of the Brand
Visual Design
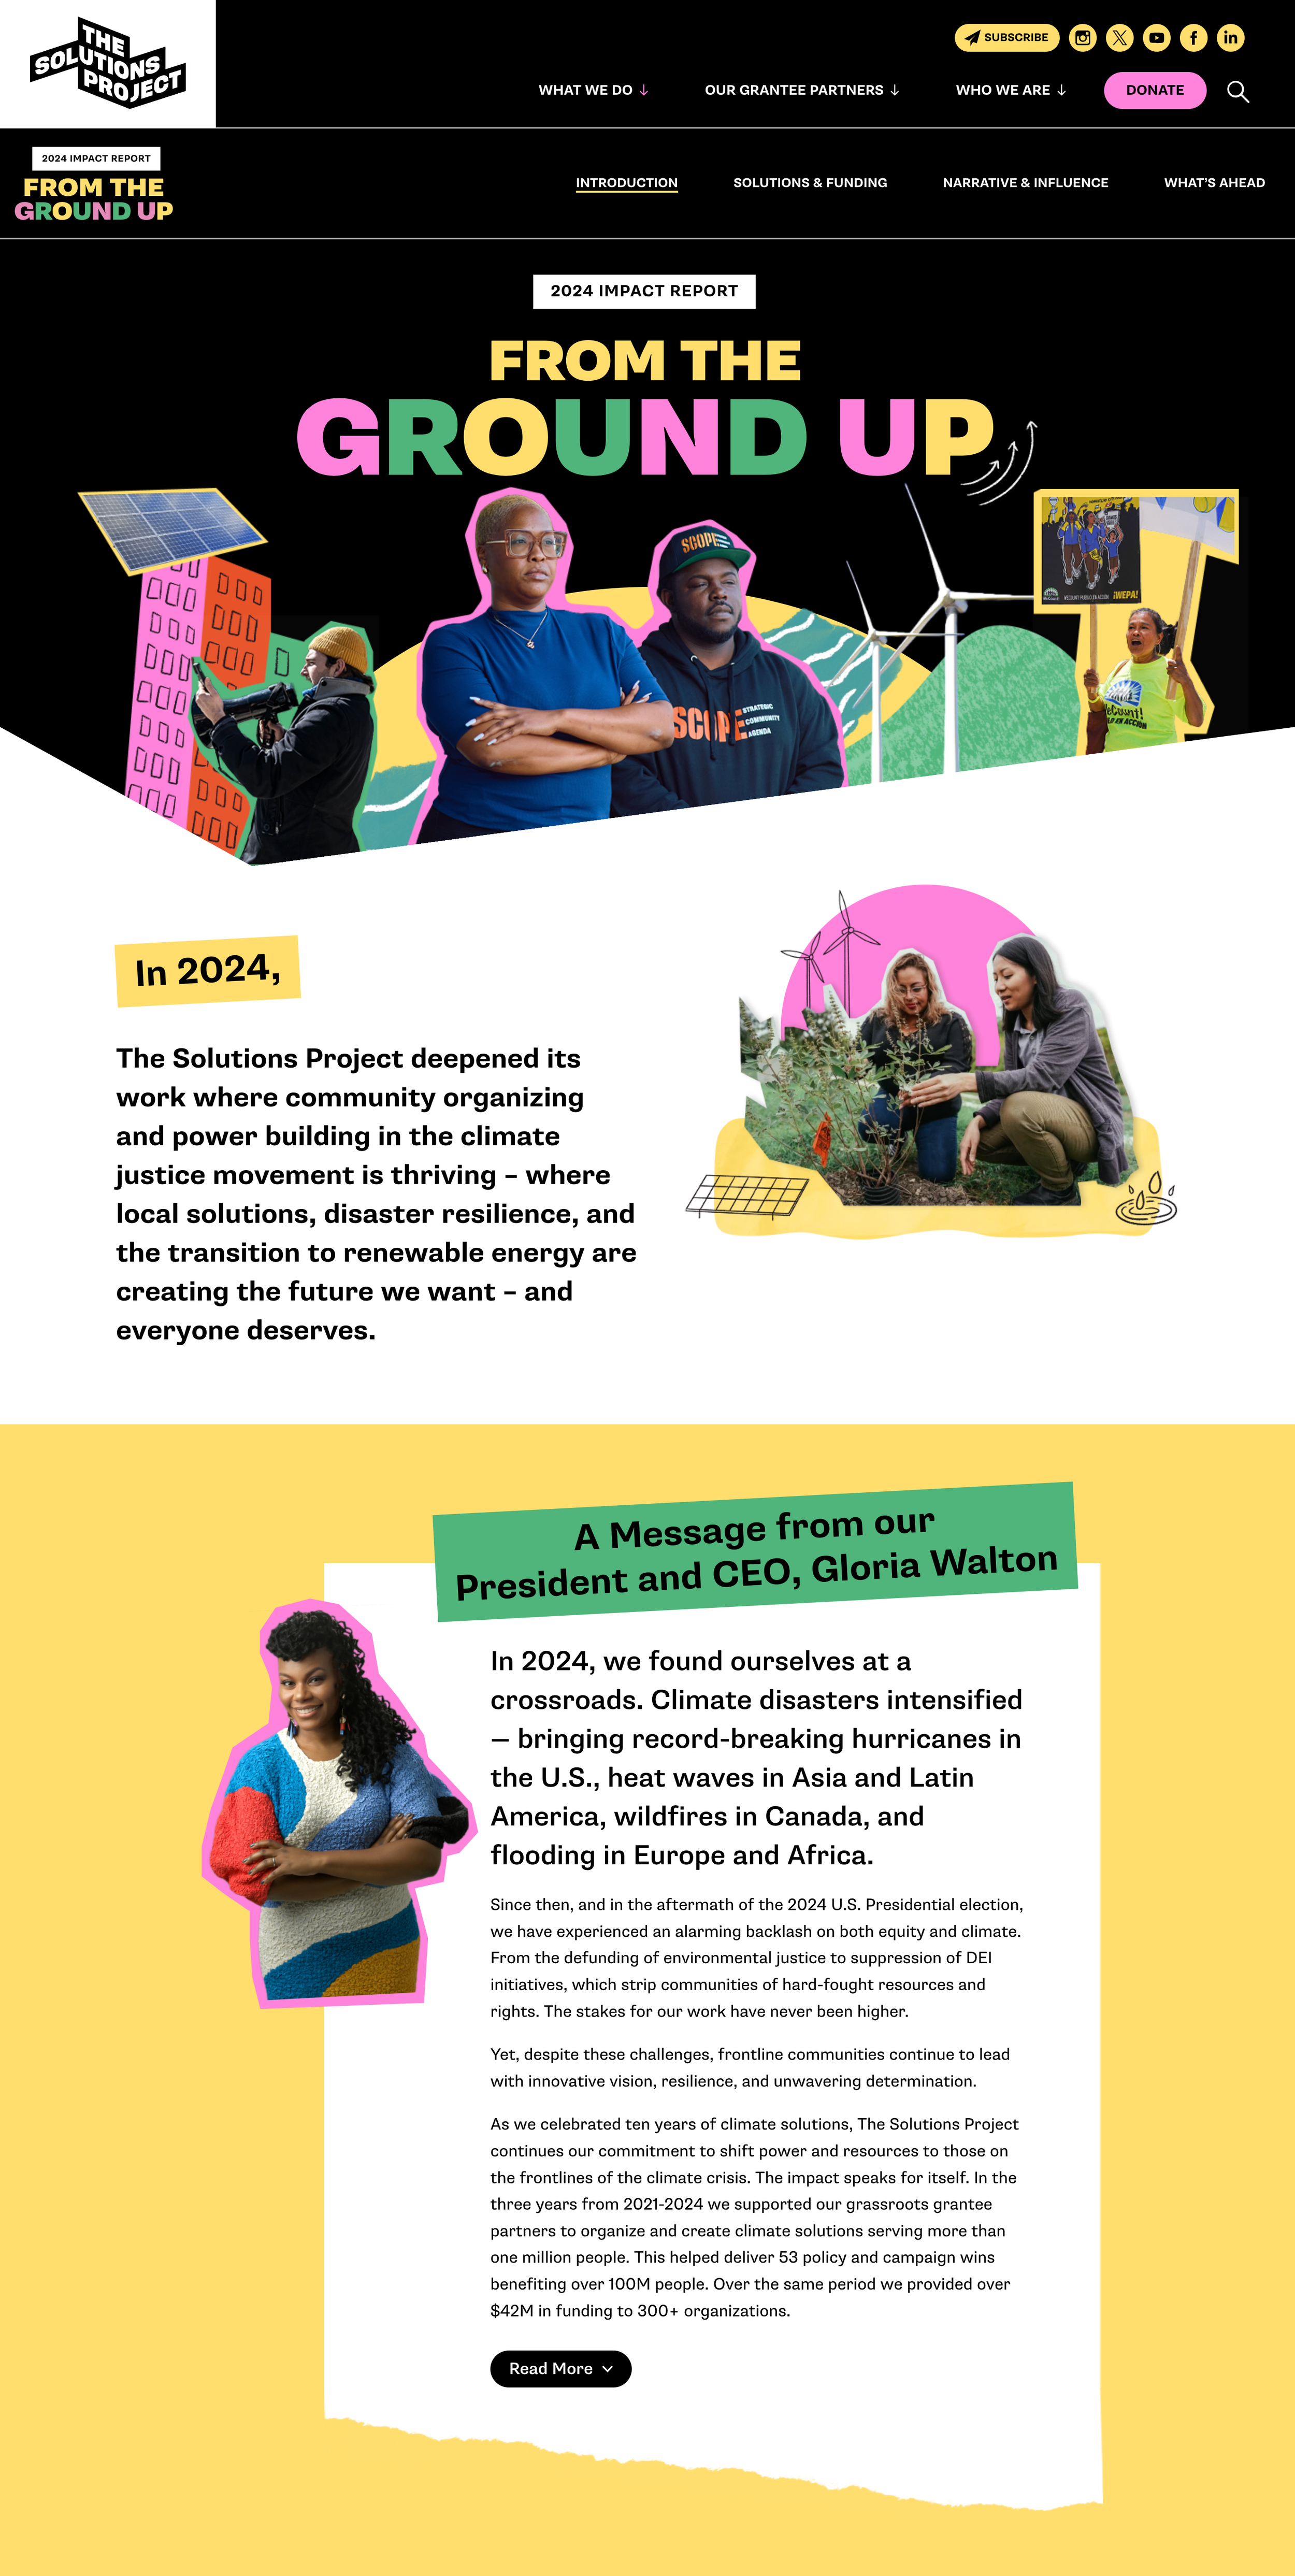
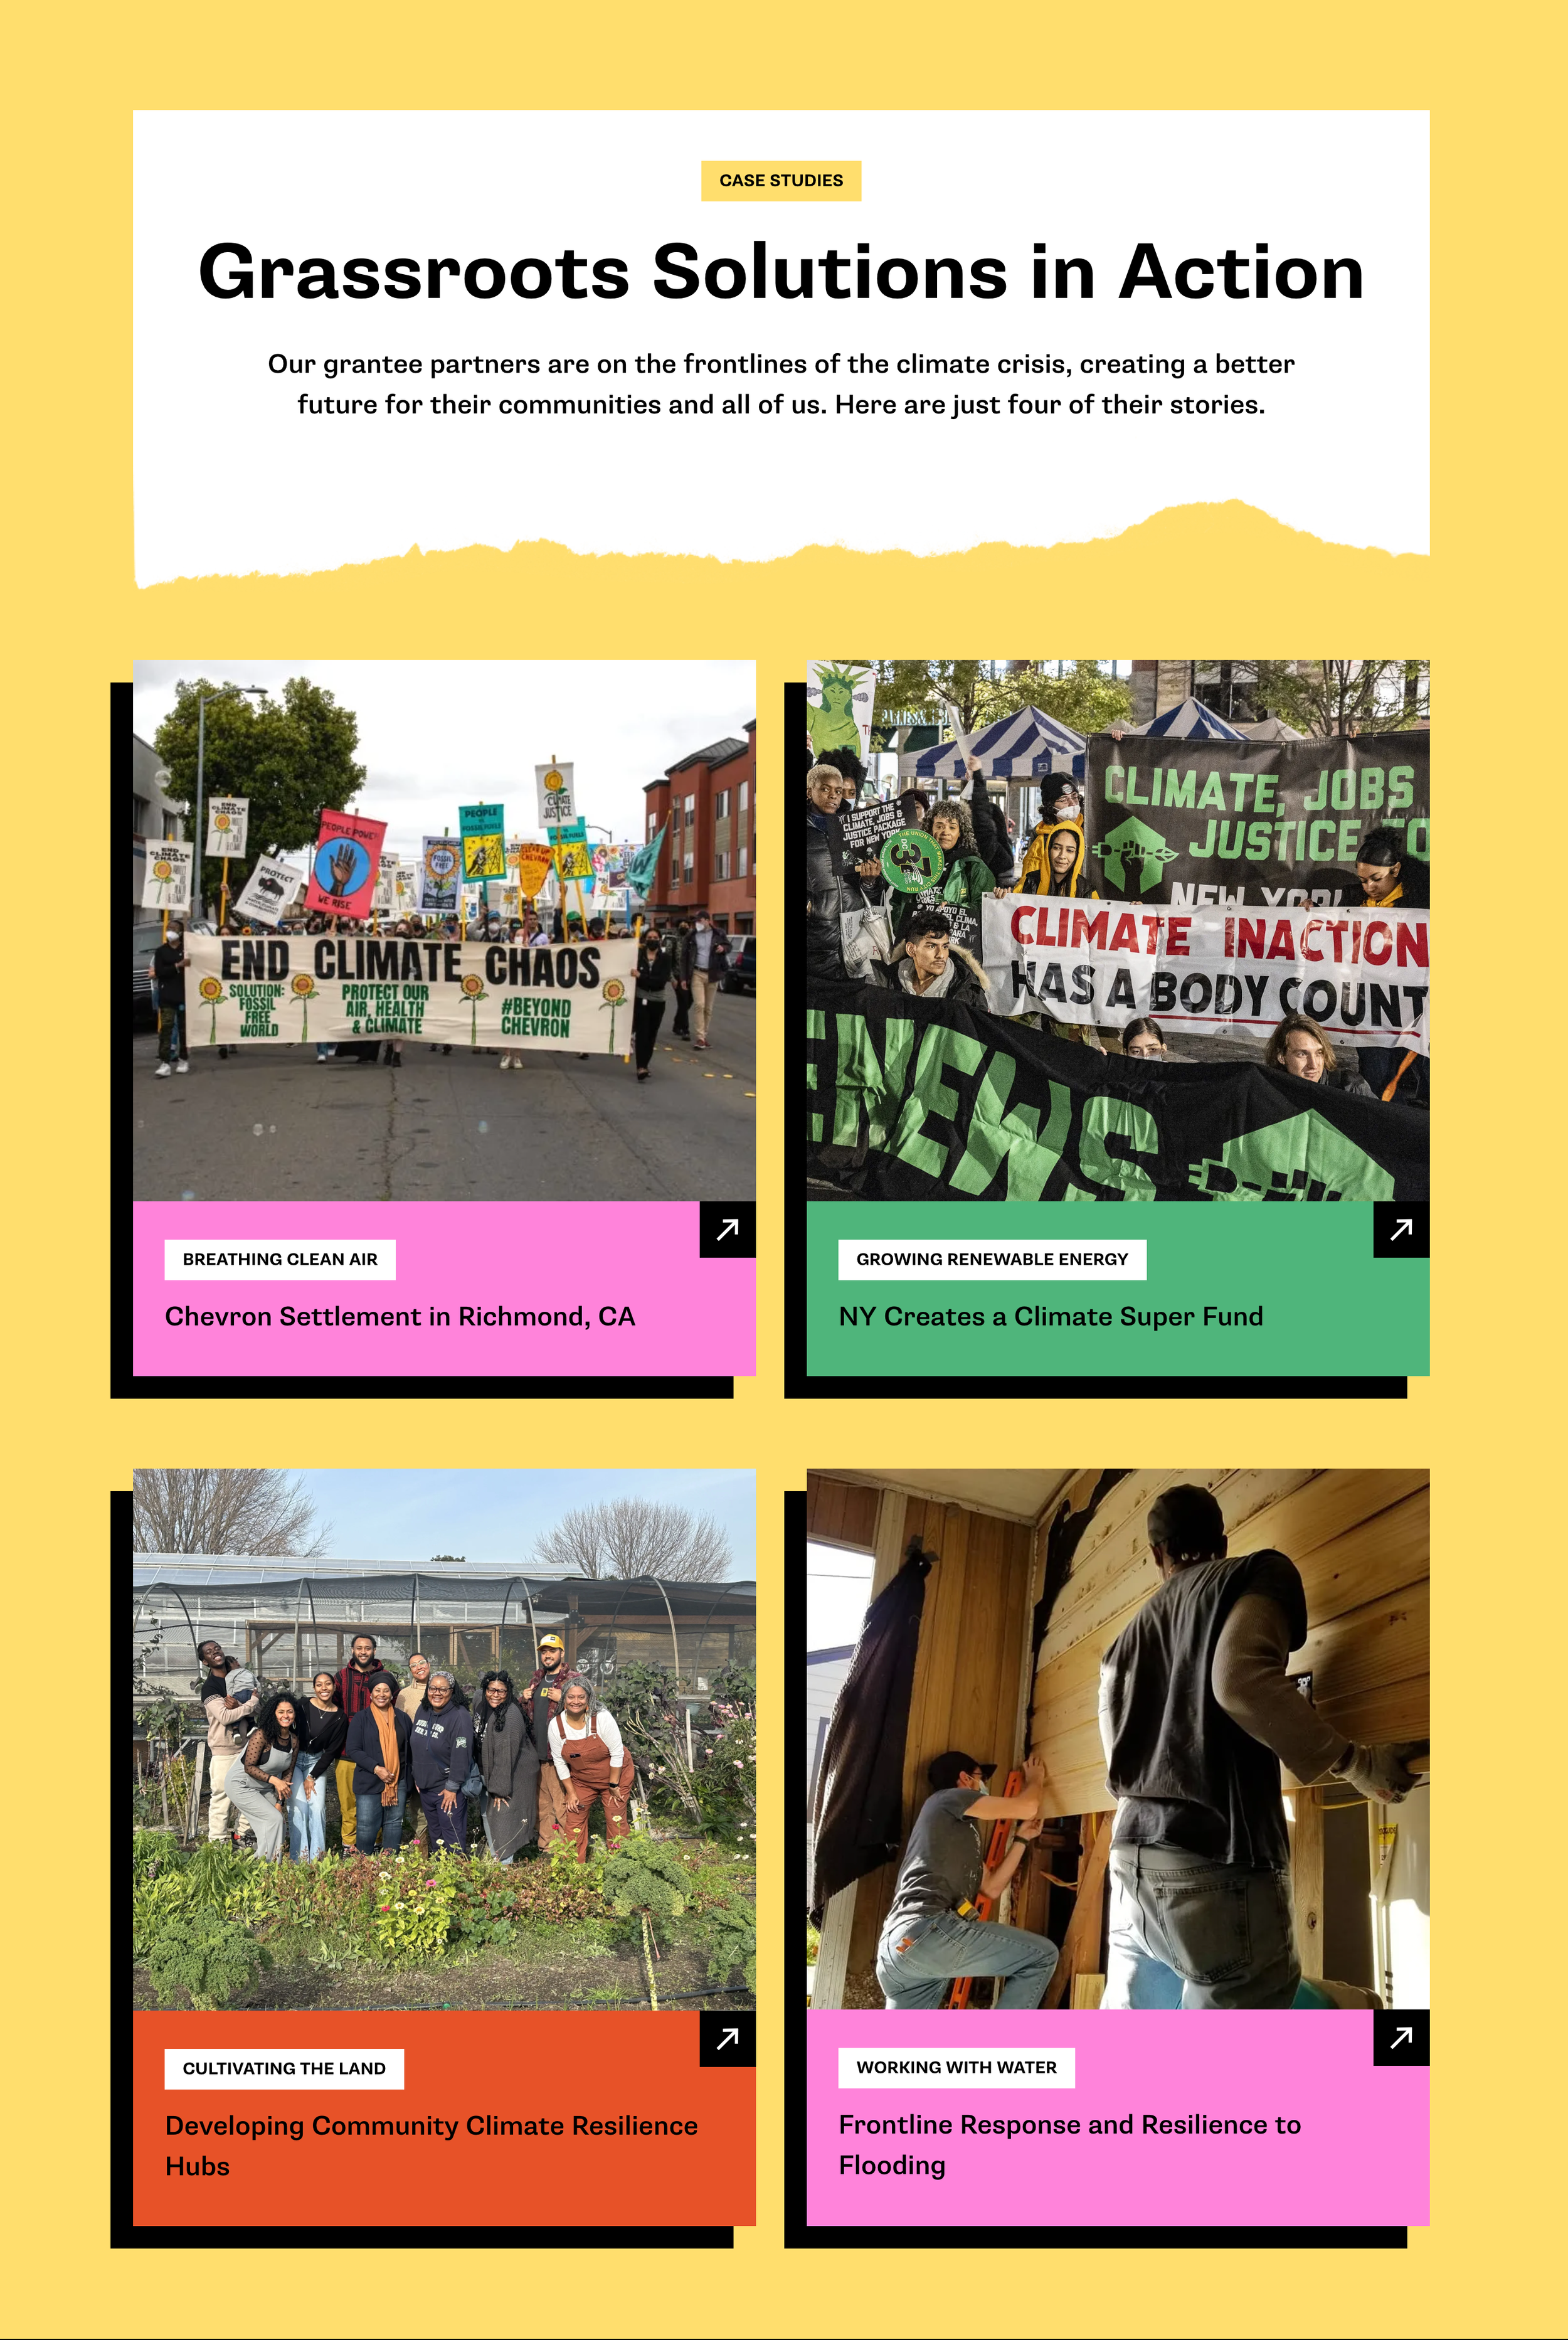
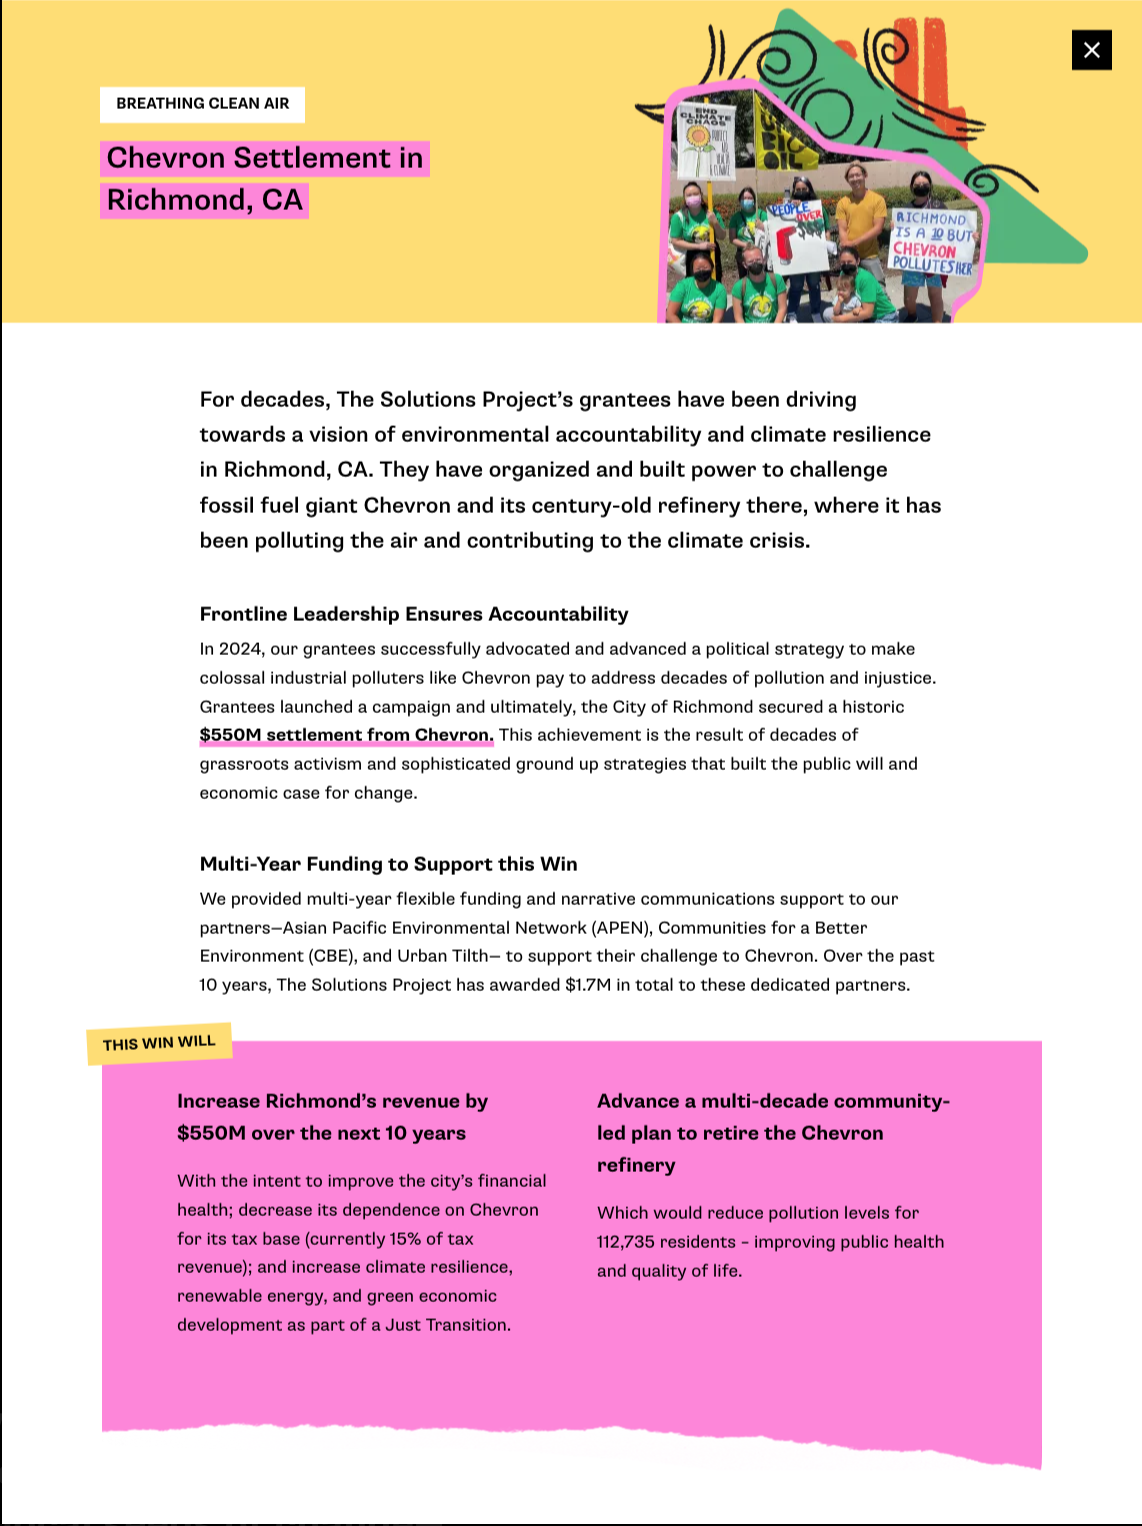
The visual direction for the 2024 Impact Report was rooted in continuity with The Solutions Project’s From the Ground Up video, using its collage style and people-centered imagery as a foundation.
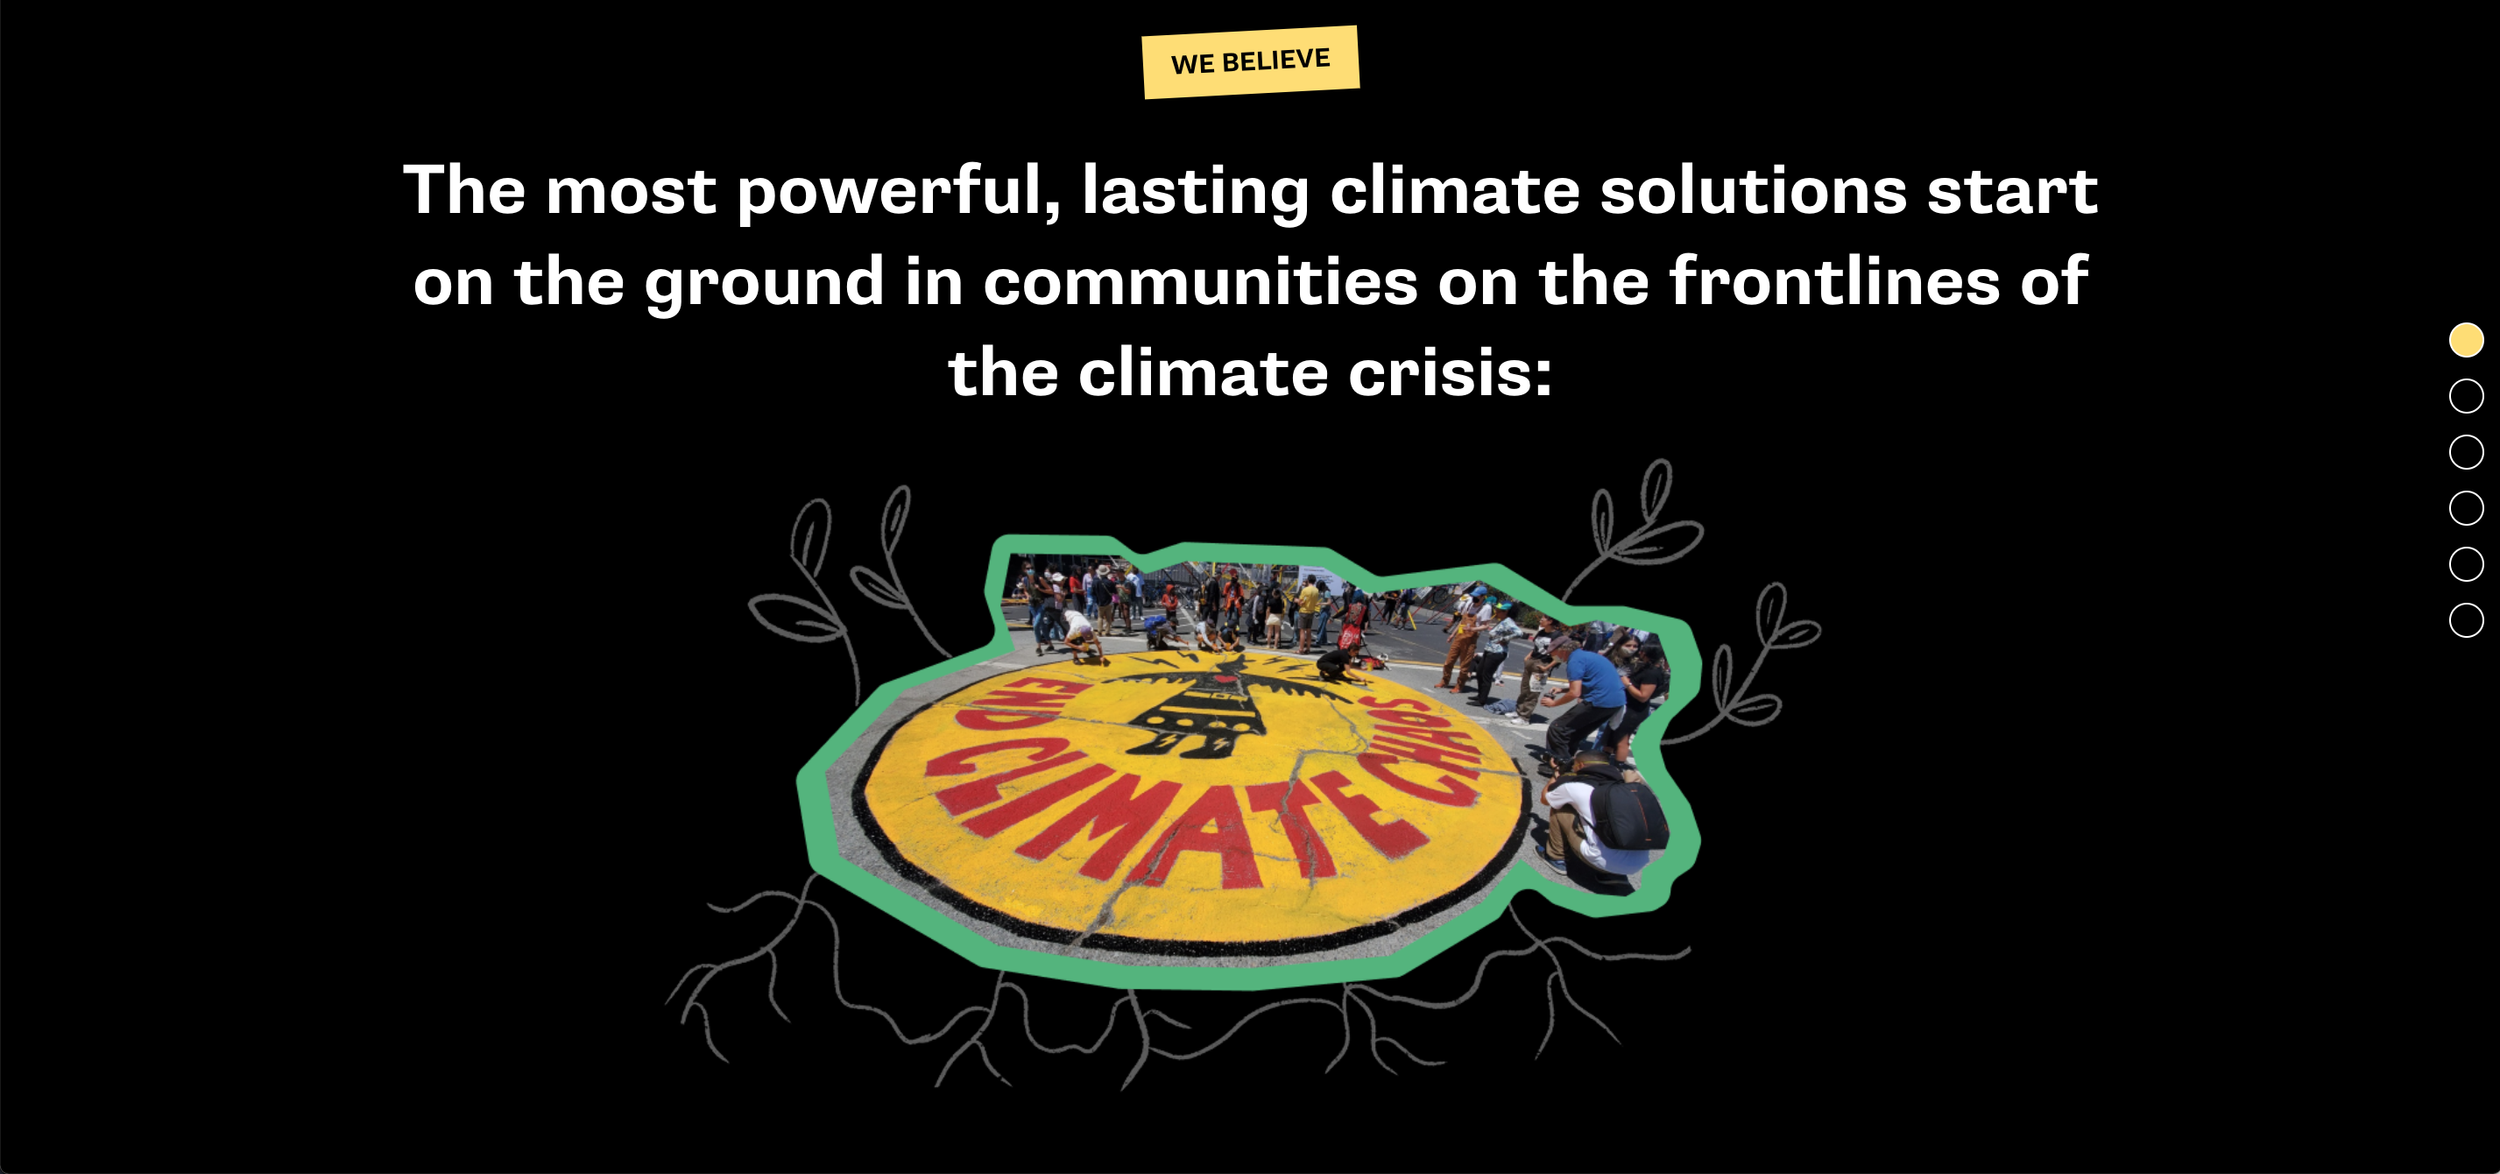
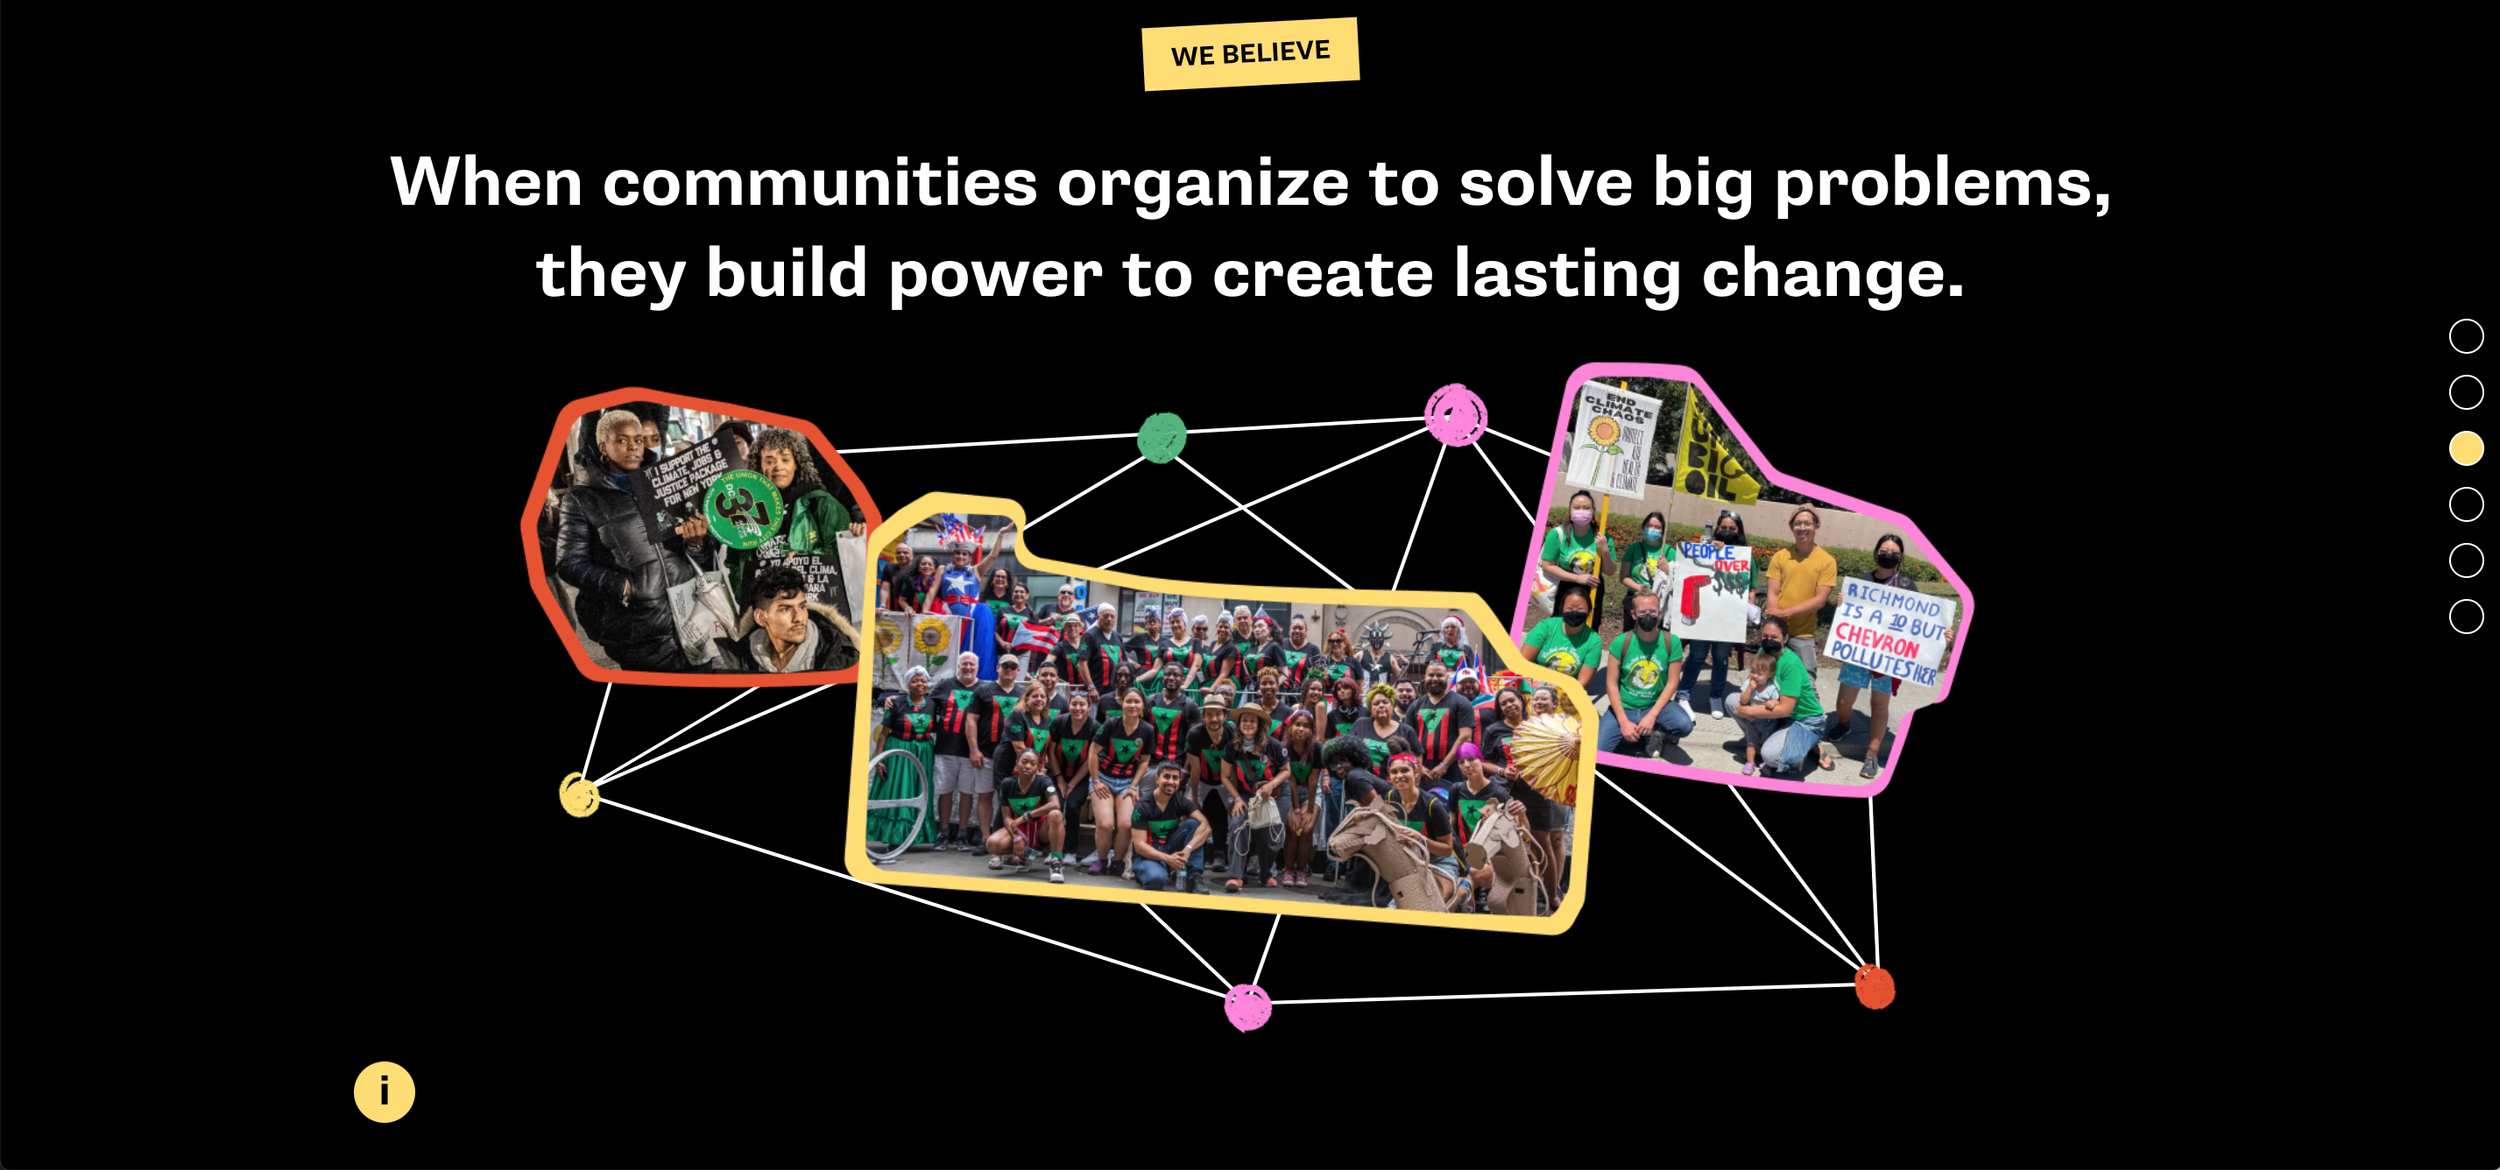
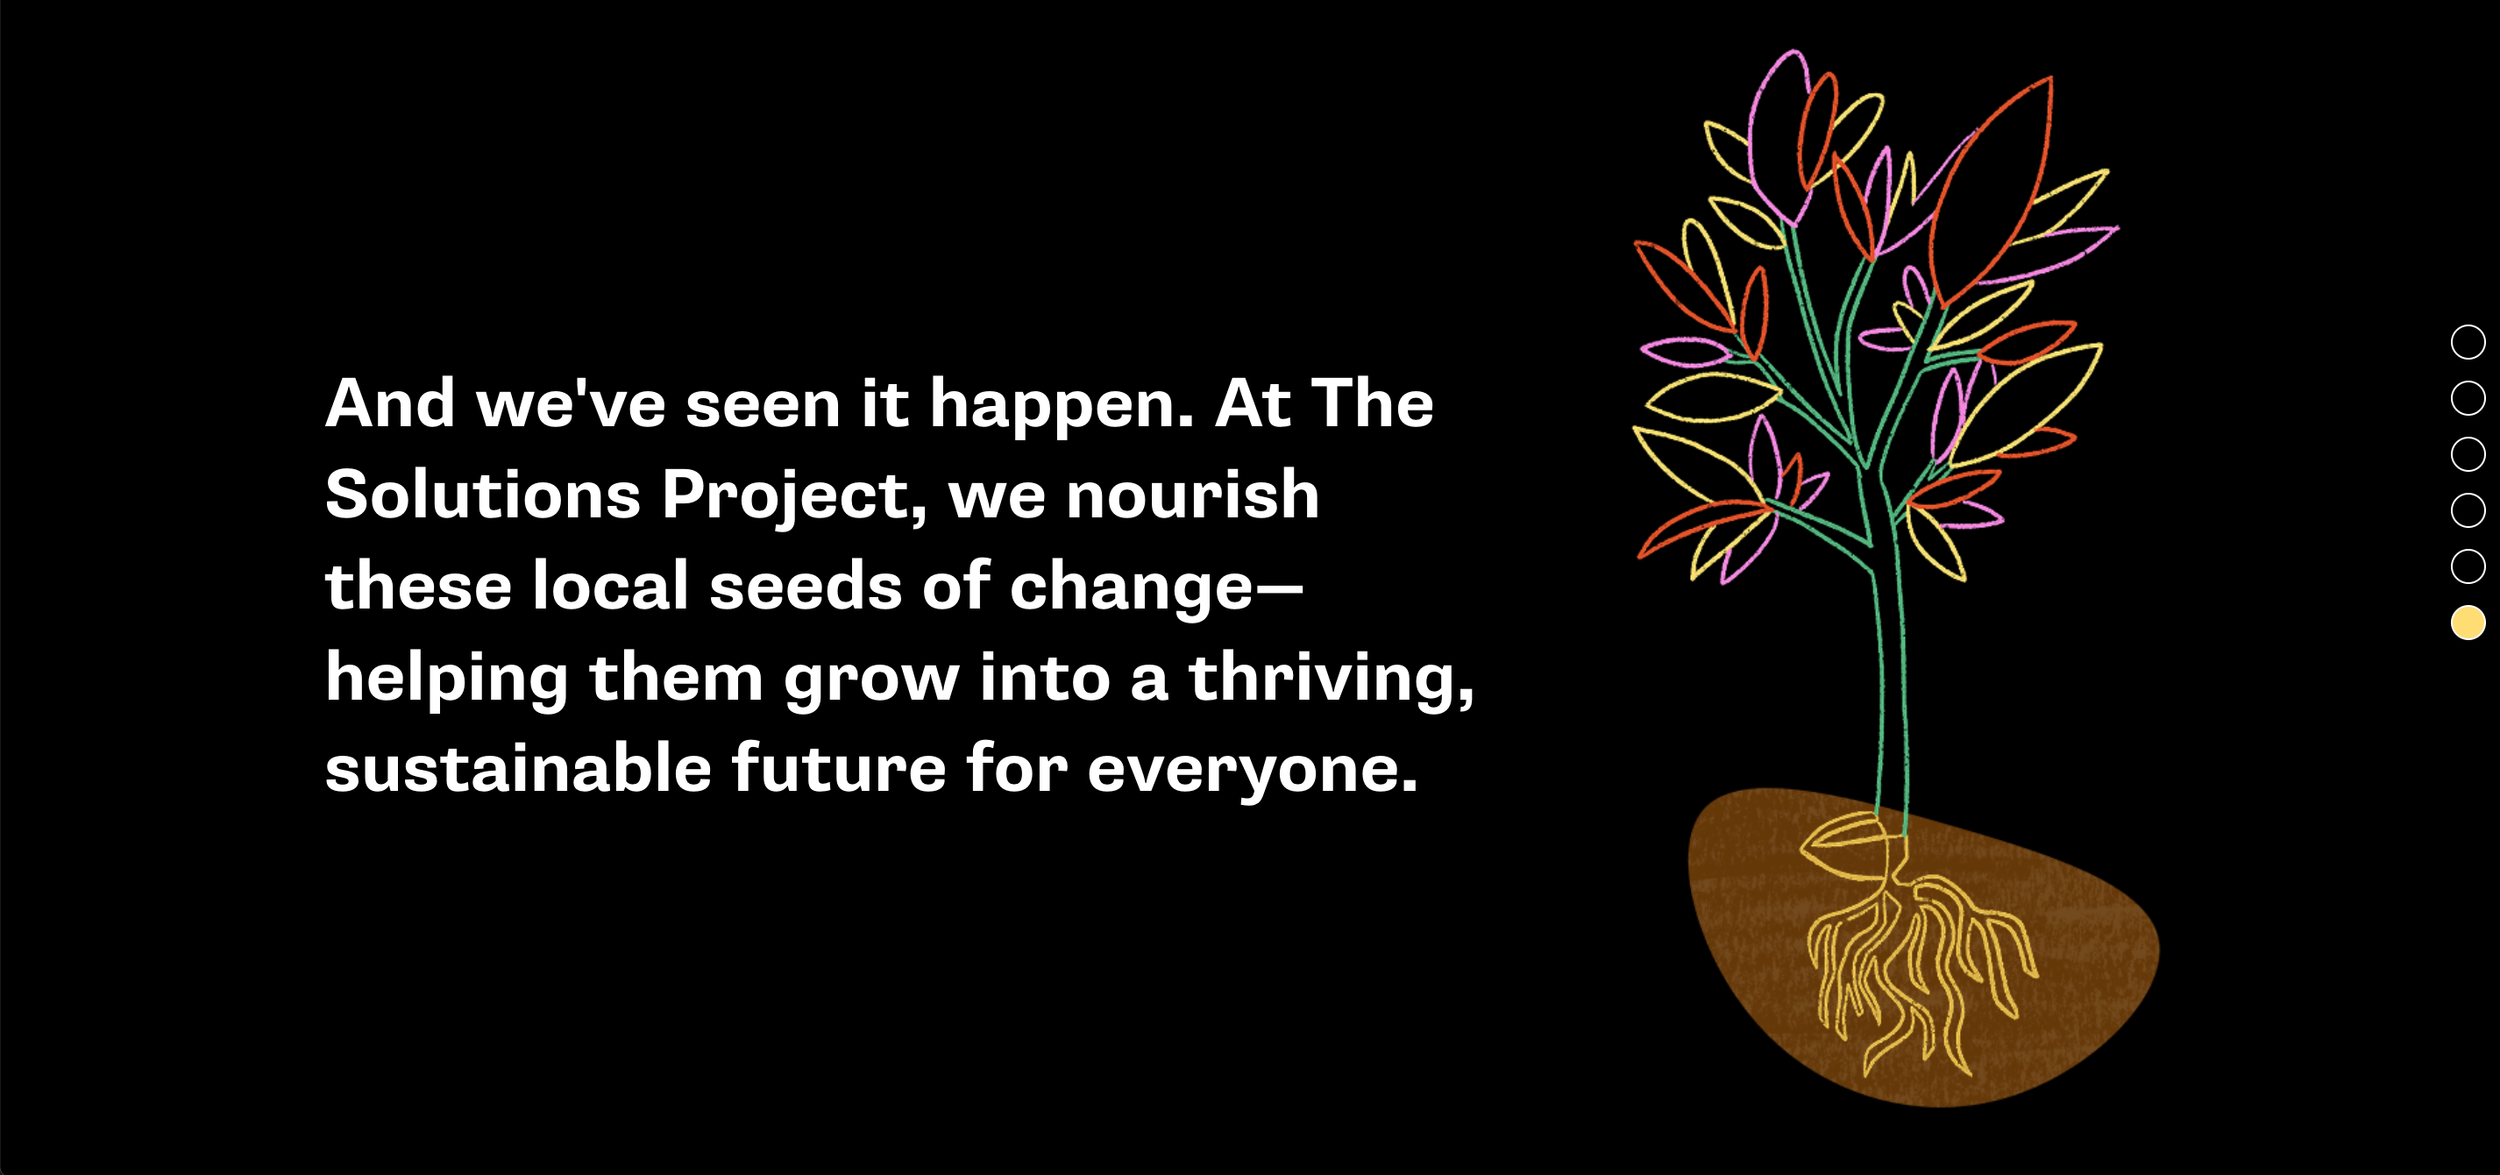
We layered in organic textures, hand-drawn accents, and subtle animations to create a grounded yet dynamic feel. Growing imagery, like plants emerging from soil, became a metaphor for community-led climate solutions, while collage cutouts placed people and communities at the center of the story.
Pop-up animations and thematic elements representing land, air, energy, and water added depth and movement, reinforcing the idea that powerful change emerges collectively, from the ground up.
Results
-
An Engaging, Theme-Driven Digital Report
We balanced storytelling, interactivity, and accessibility, successfully bringing From the Ground Up to life for diverse audiences.
-
Donor-Focused PDF Report
To accompany the digital report, I also created a condensed version of the report in a shareable format tailored for fundraising and stakeholder communications.
-
Branded Social Media Templates
I designed Canva templates that equipped The Solutions Project’s communications team with ready-to-use graphics, making it easy to promote the report consistently across channels.