Reach Capital 2024 Impact Report
Data Visualization • Impact Storytelling • Investor Communications
I designed Reach Capital’s 2024 Impact Report as an investor-facing presentation deck, translating complex research and portfolio metrics into clear, compelling data visualizations. My role centered on building a cohesive visual system that illustrated each company’s impact journey, highlighting growth, access, and quality in a way that made outcomes easy to grasp while reinforcing Reach’s mission of investing in companies that scale meaningful change.
Visualizing the Impact Journey
I developed clear, streamlined visual frameworks to illustrate Reach Capital’s composite impact score.
I used bold color blocks, clean typography, and simple directional graphics to map how each startup progresses across scale, access, and quality. This helped investors to quickly understand a company’s growth trajectory and measurable outcomes.
Translating Trends Into Clarity
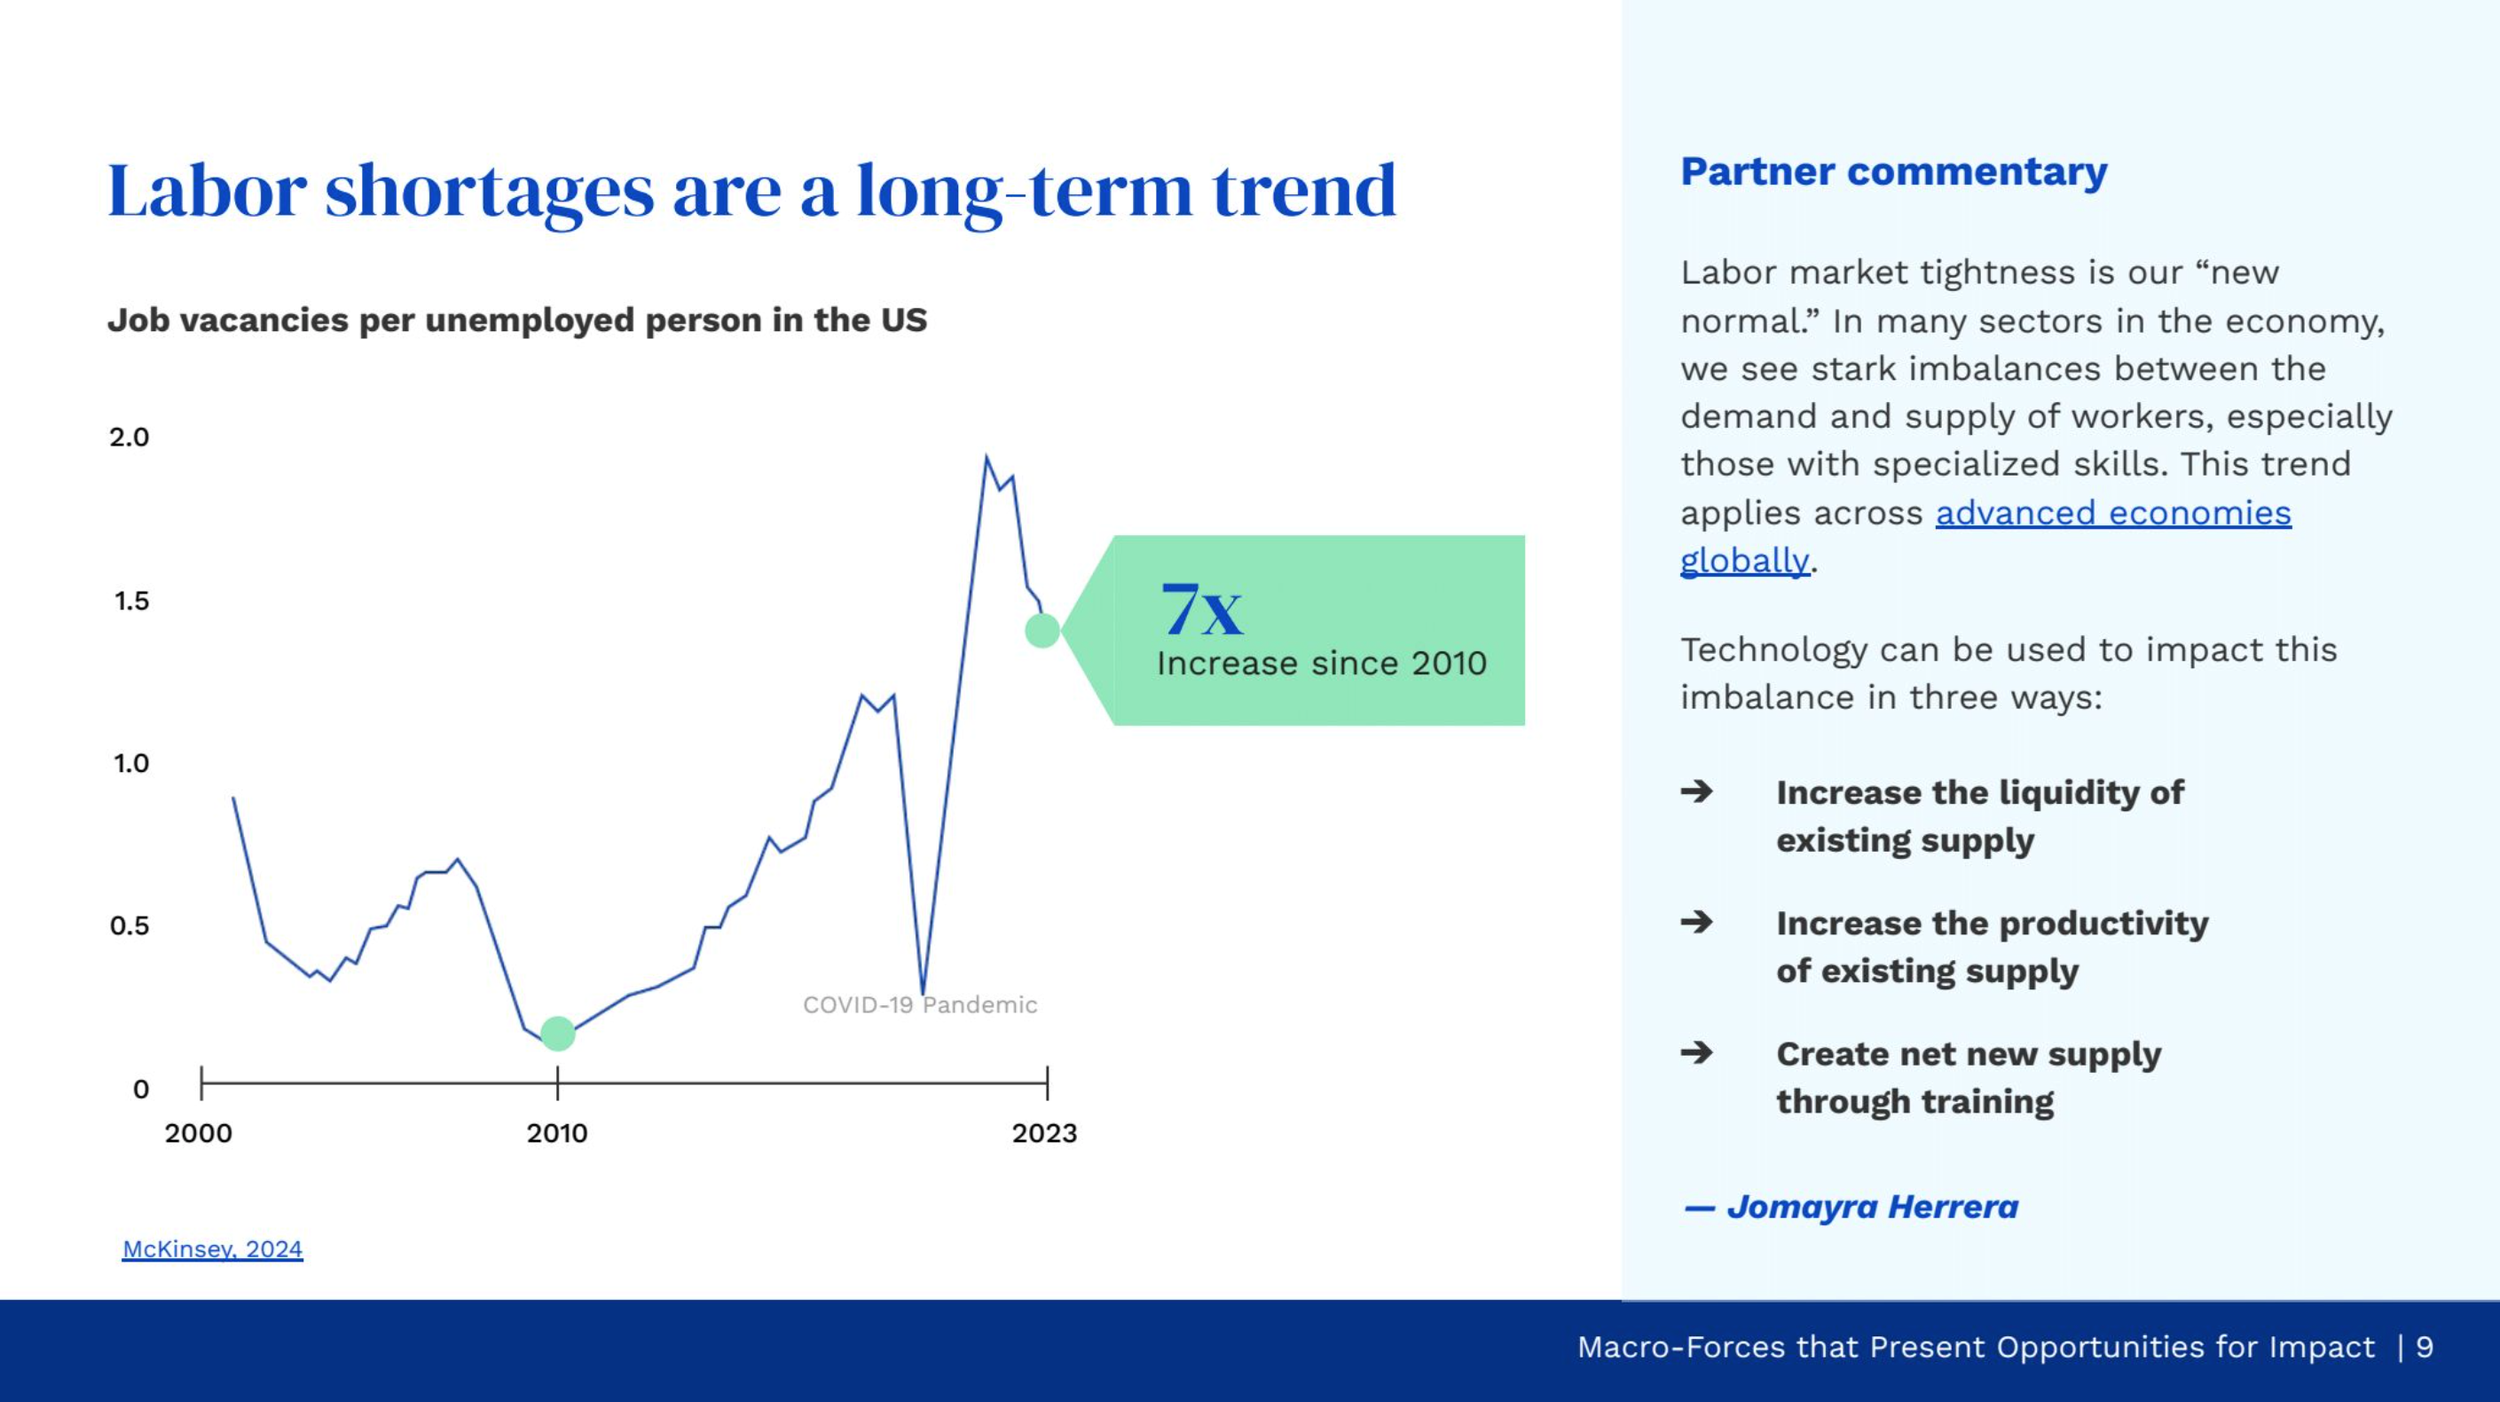
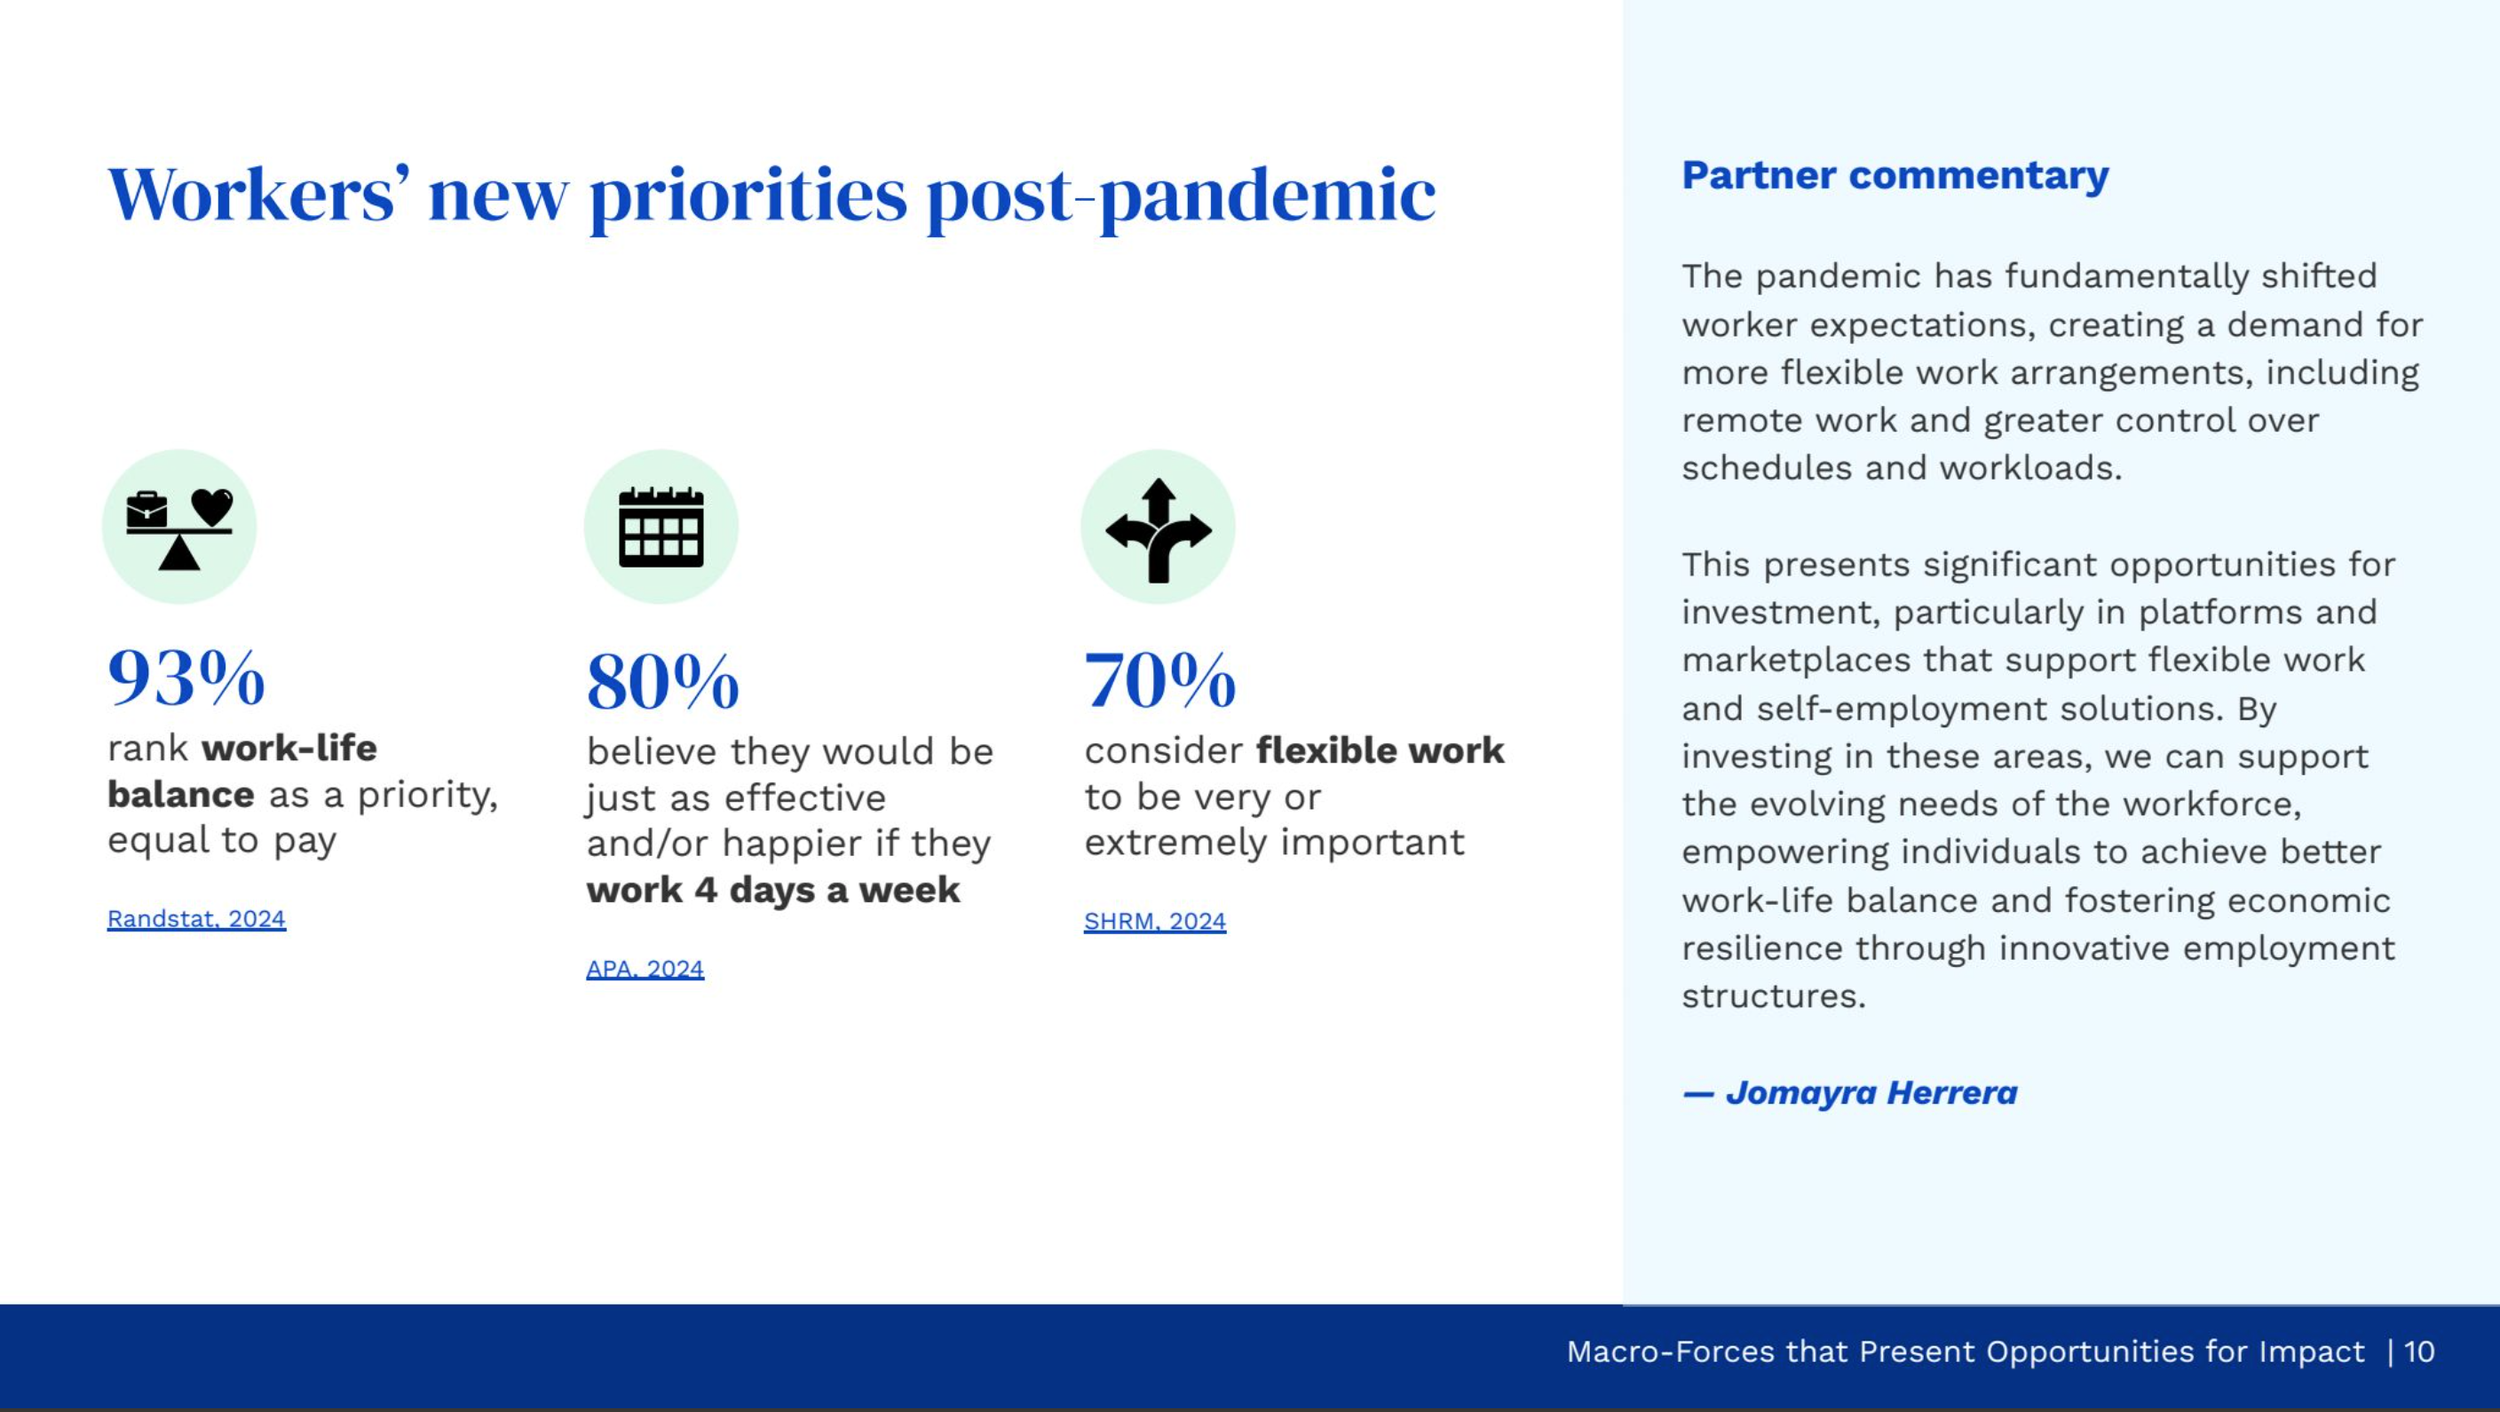
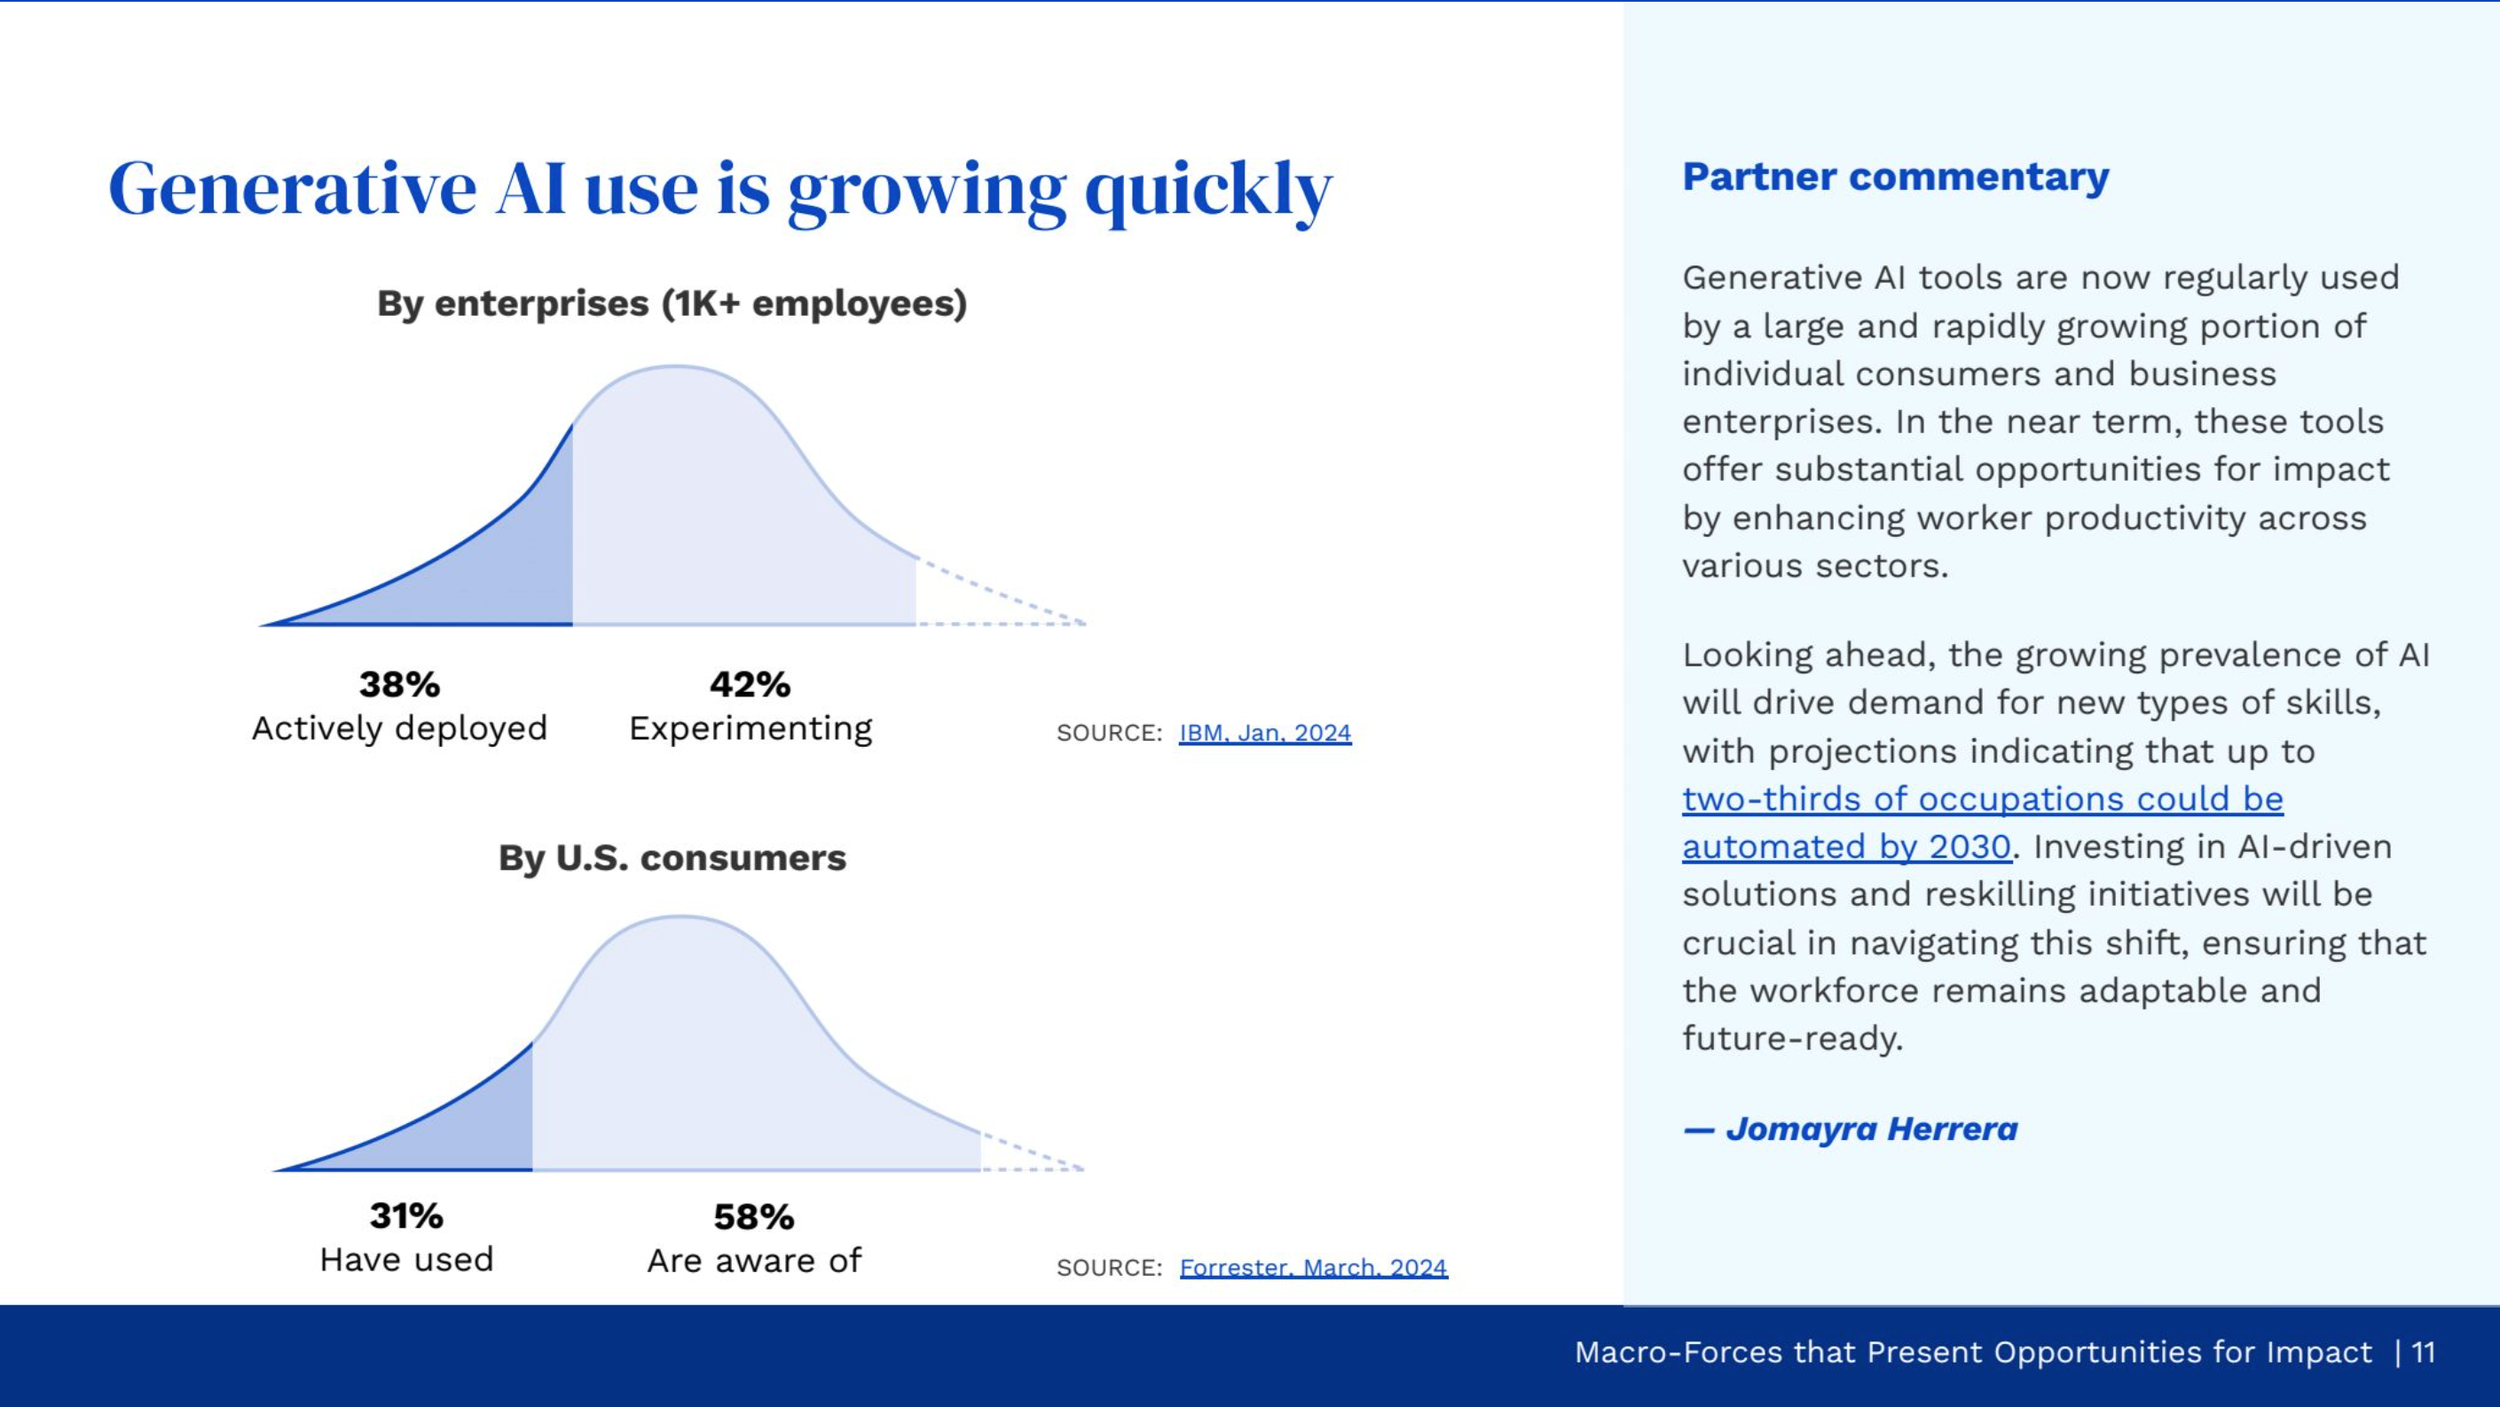
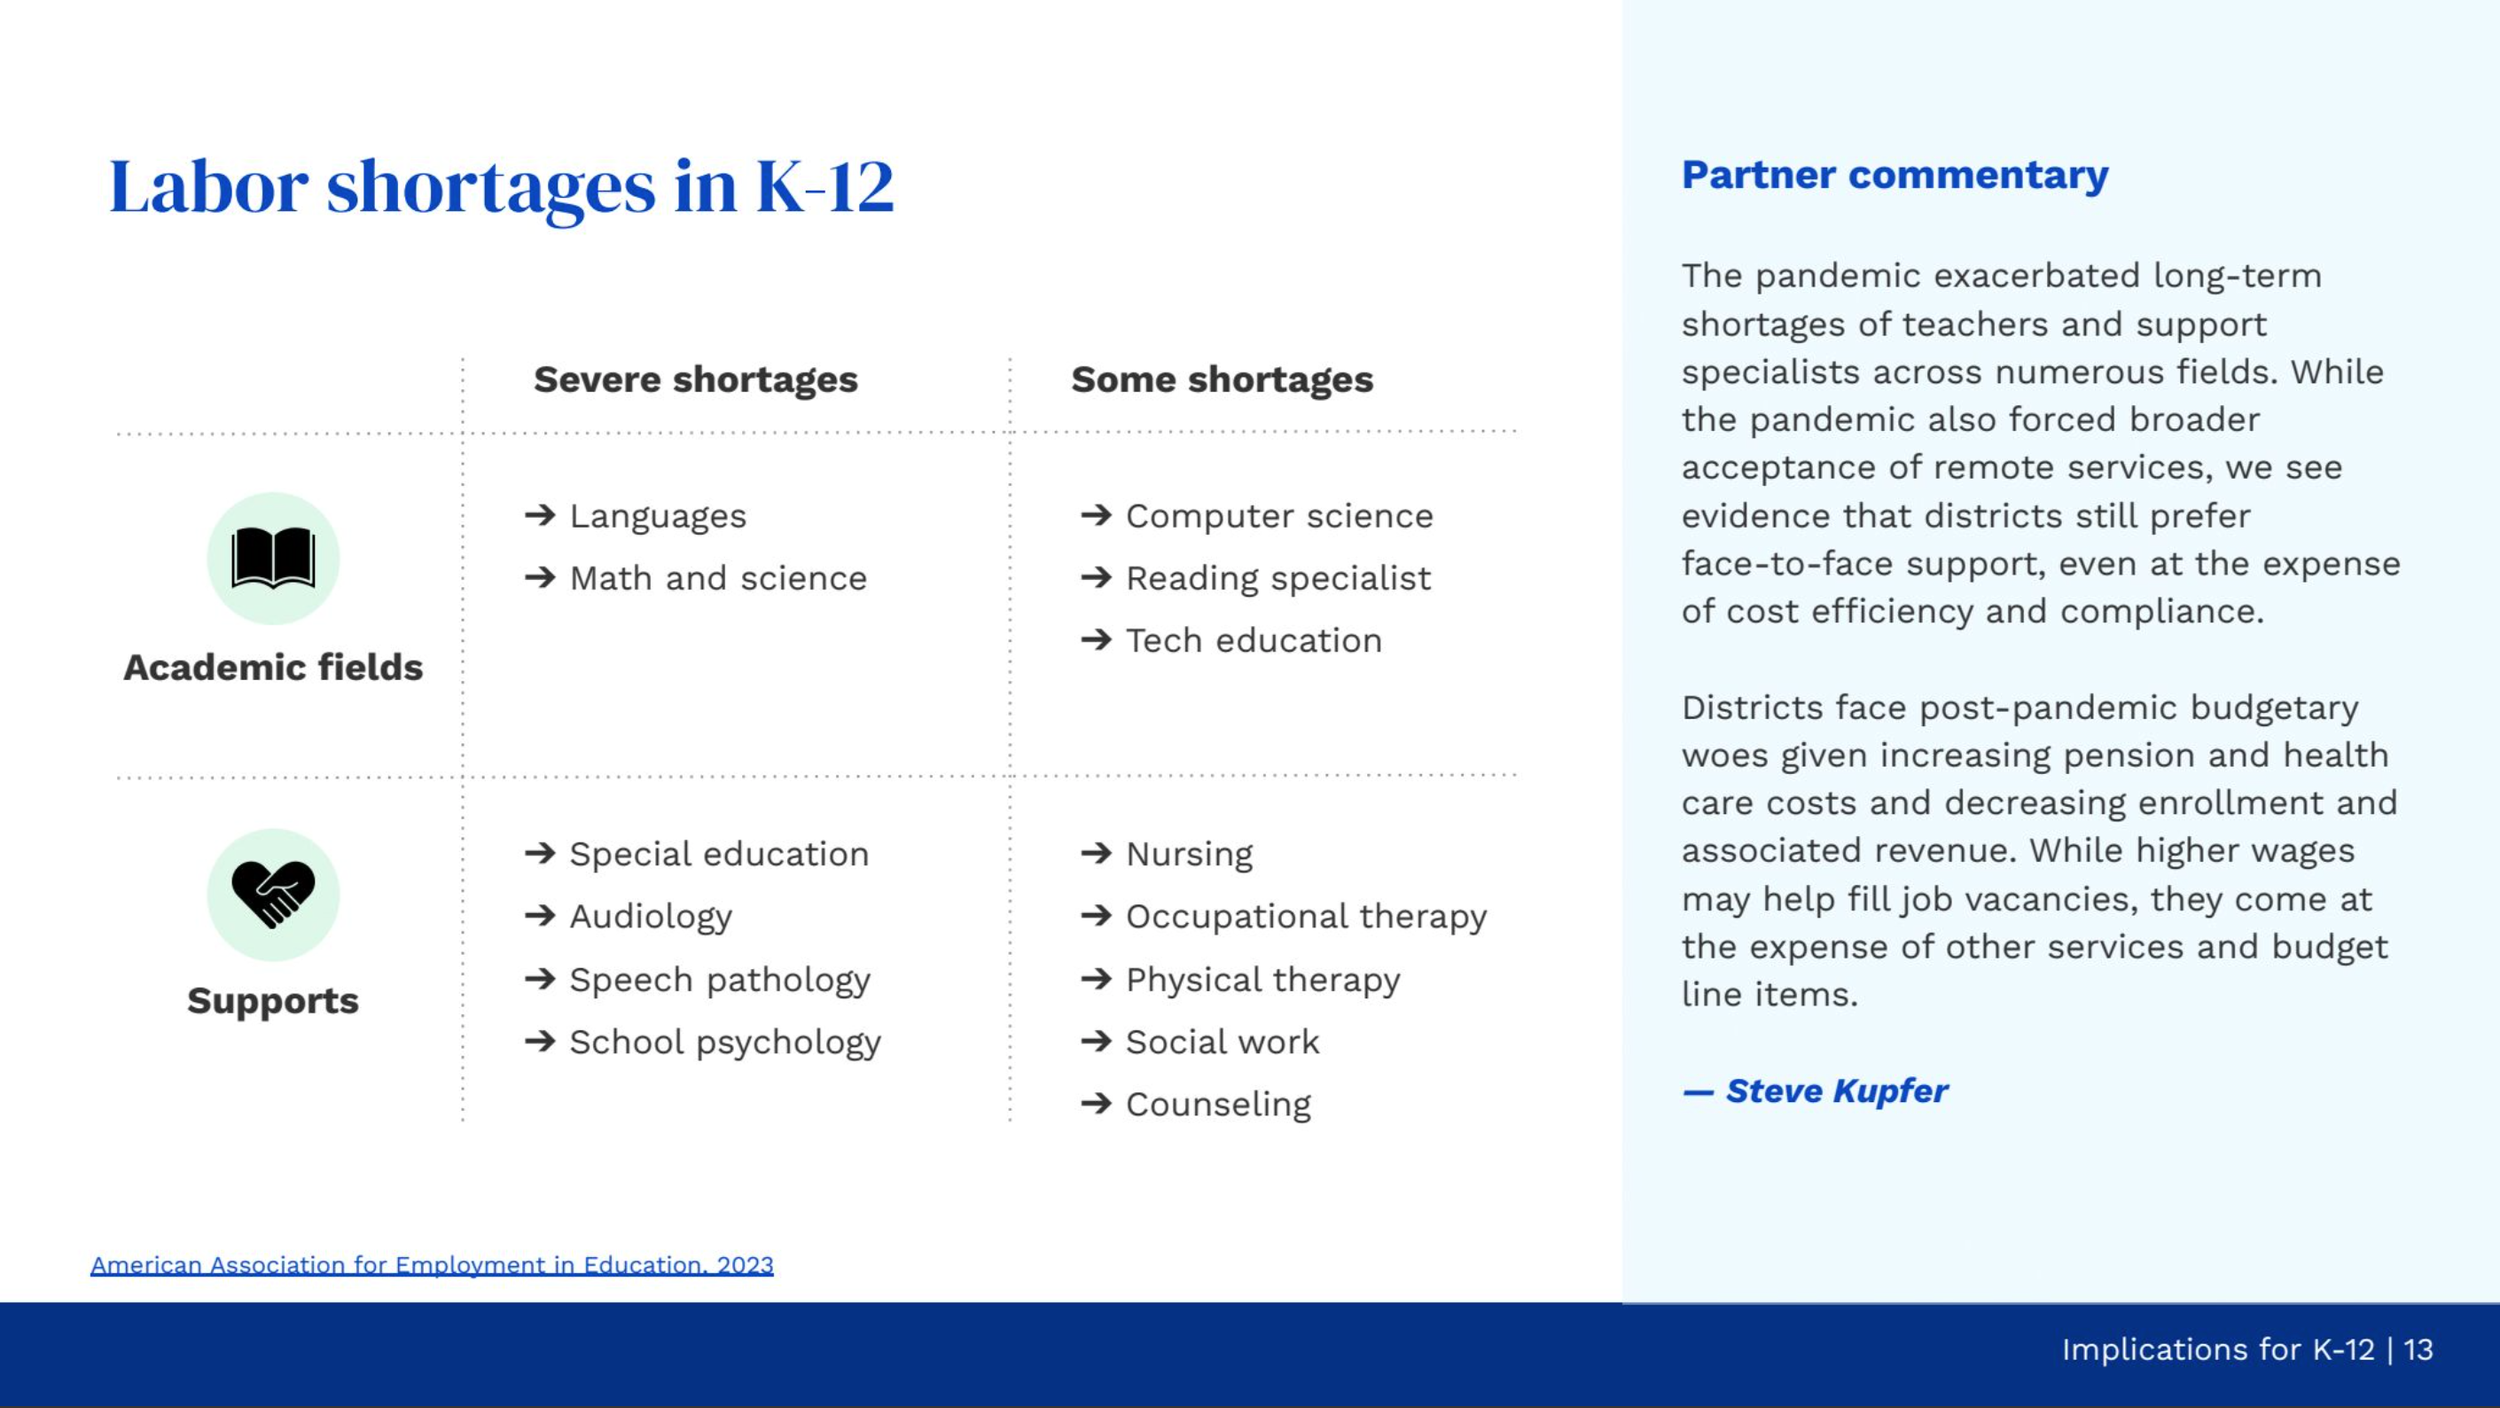
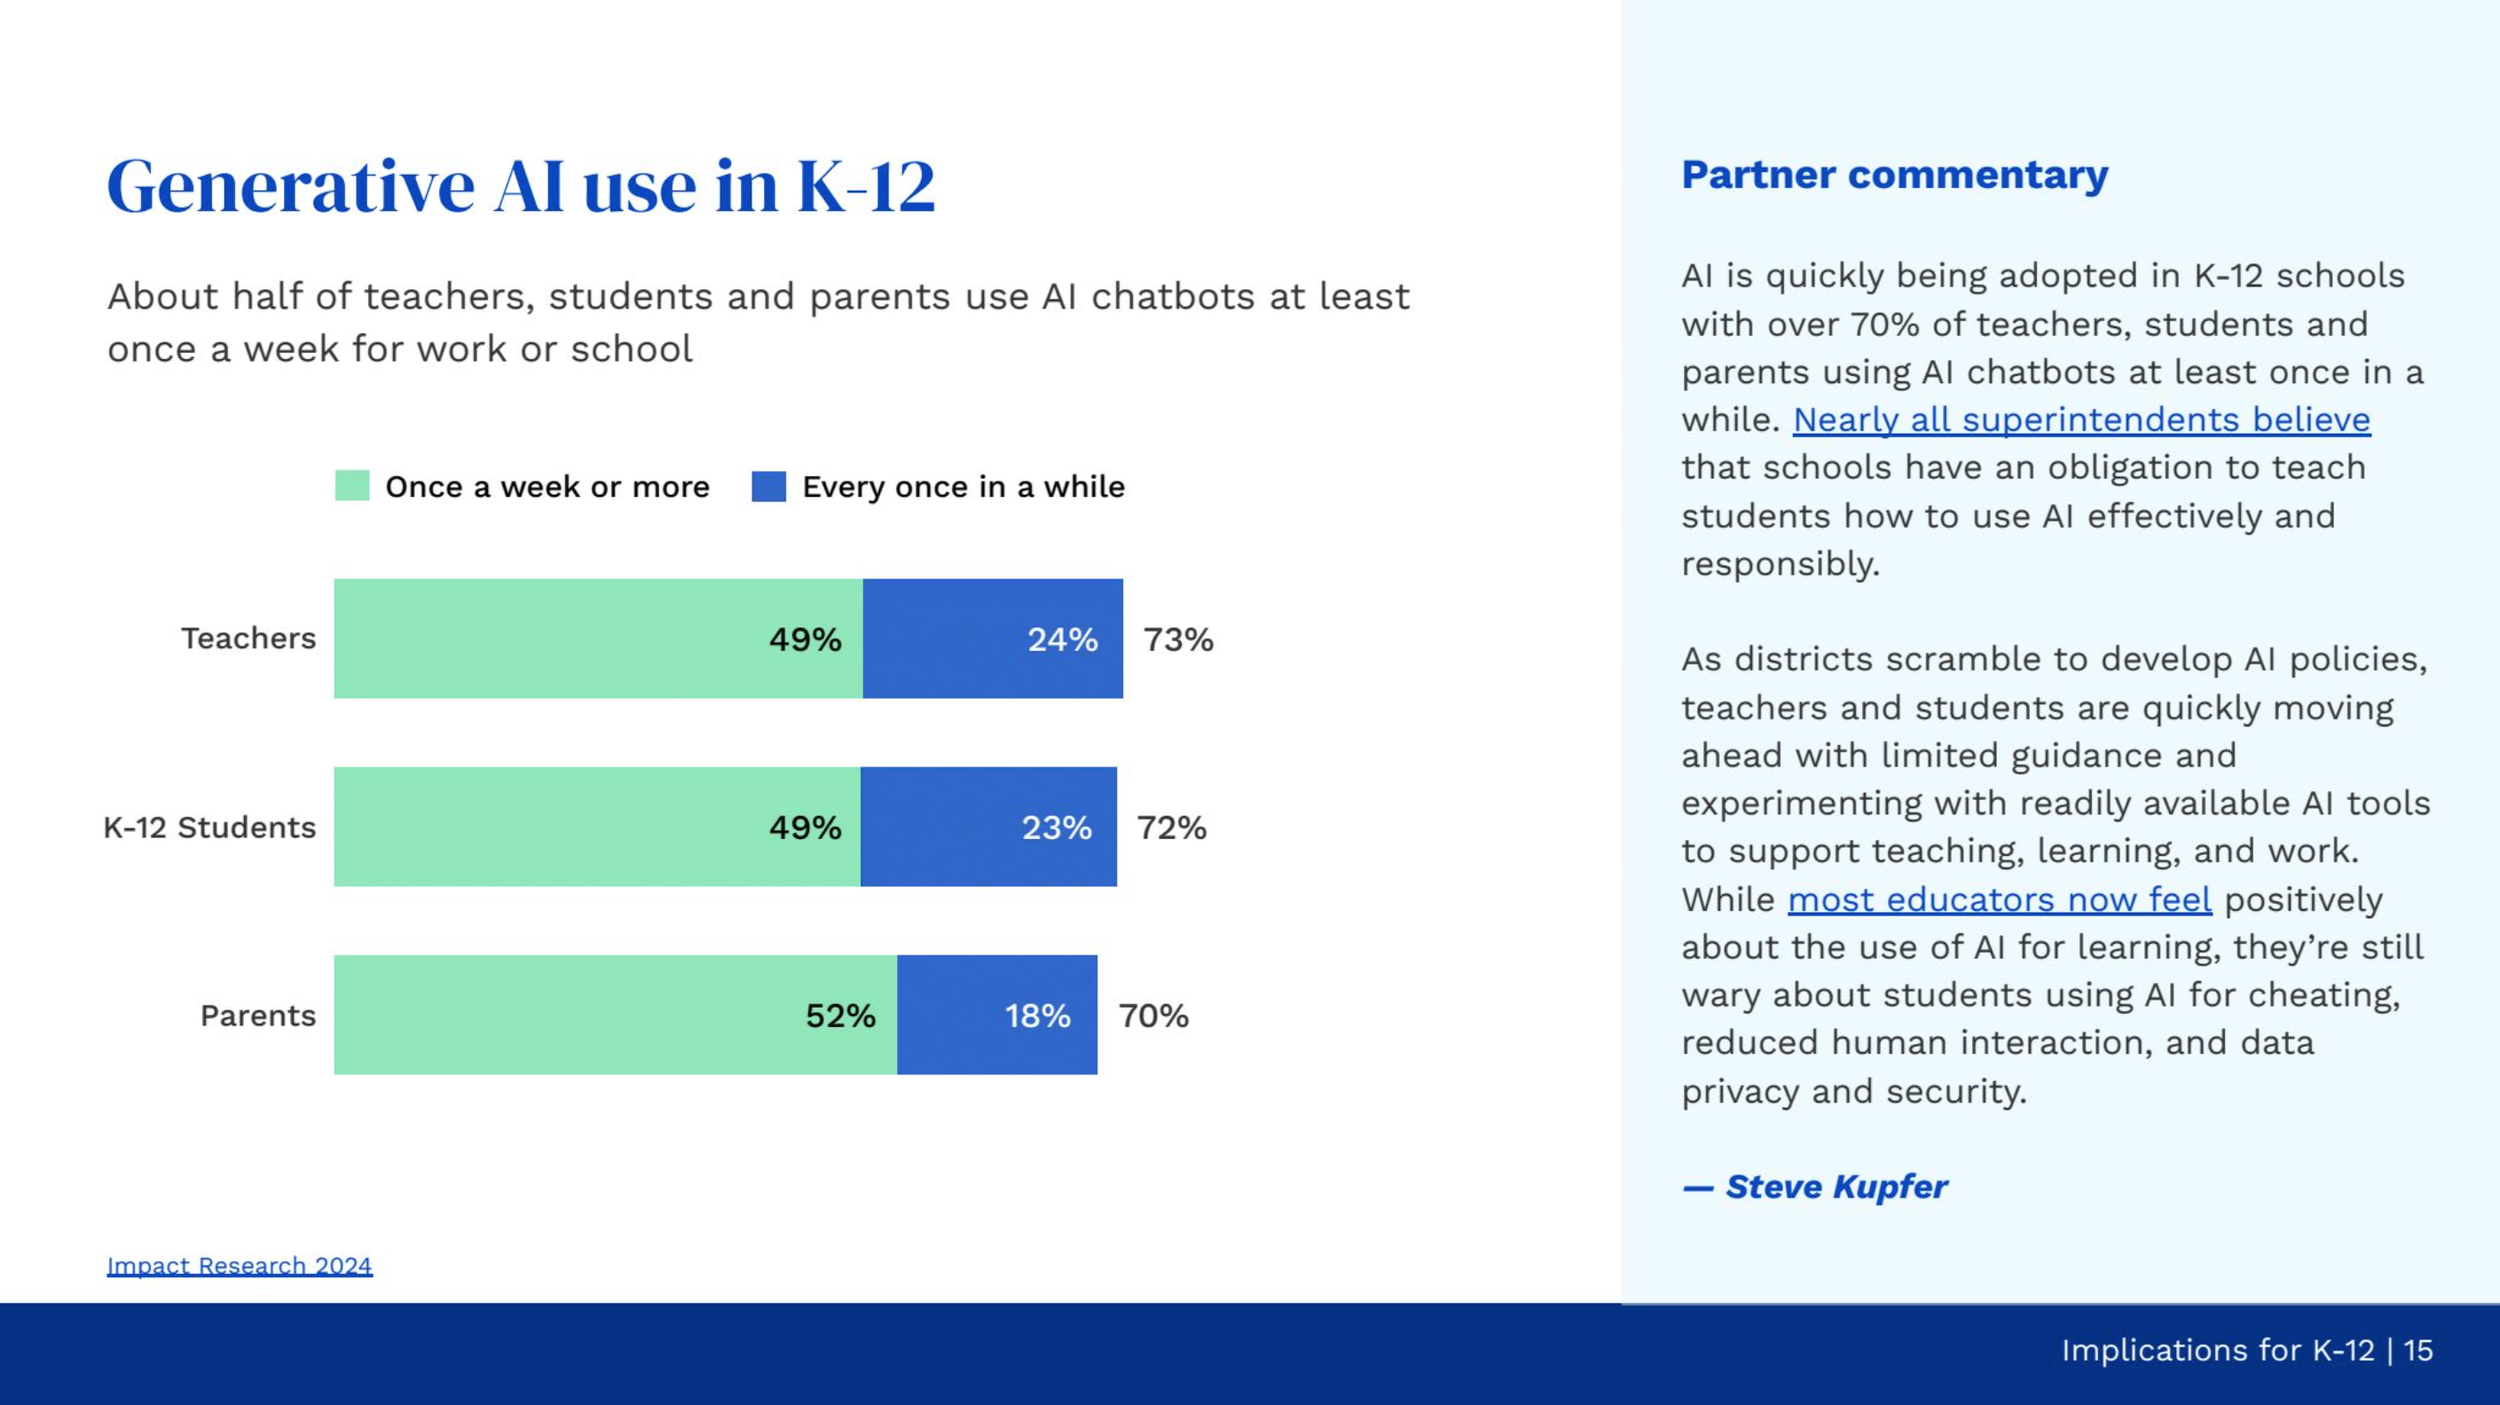
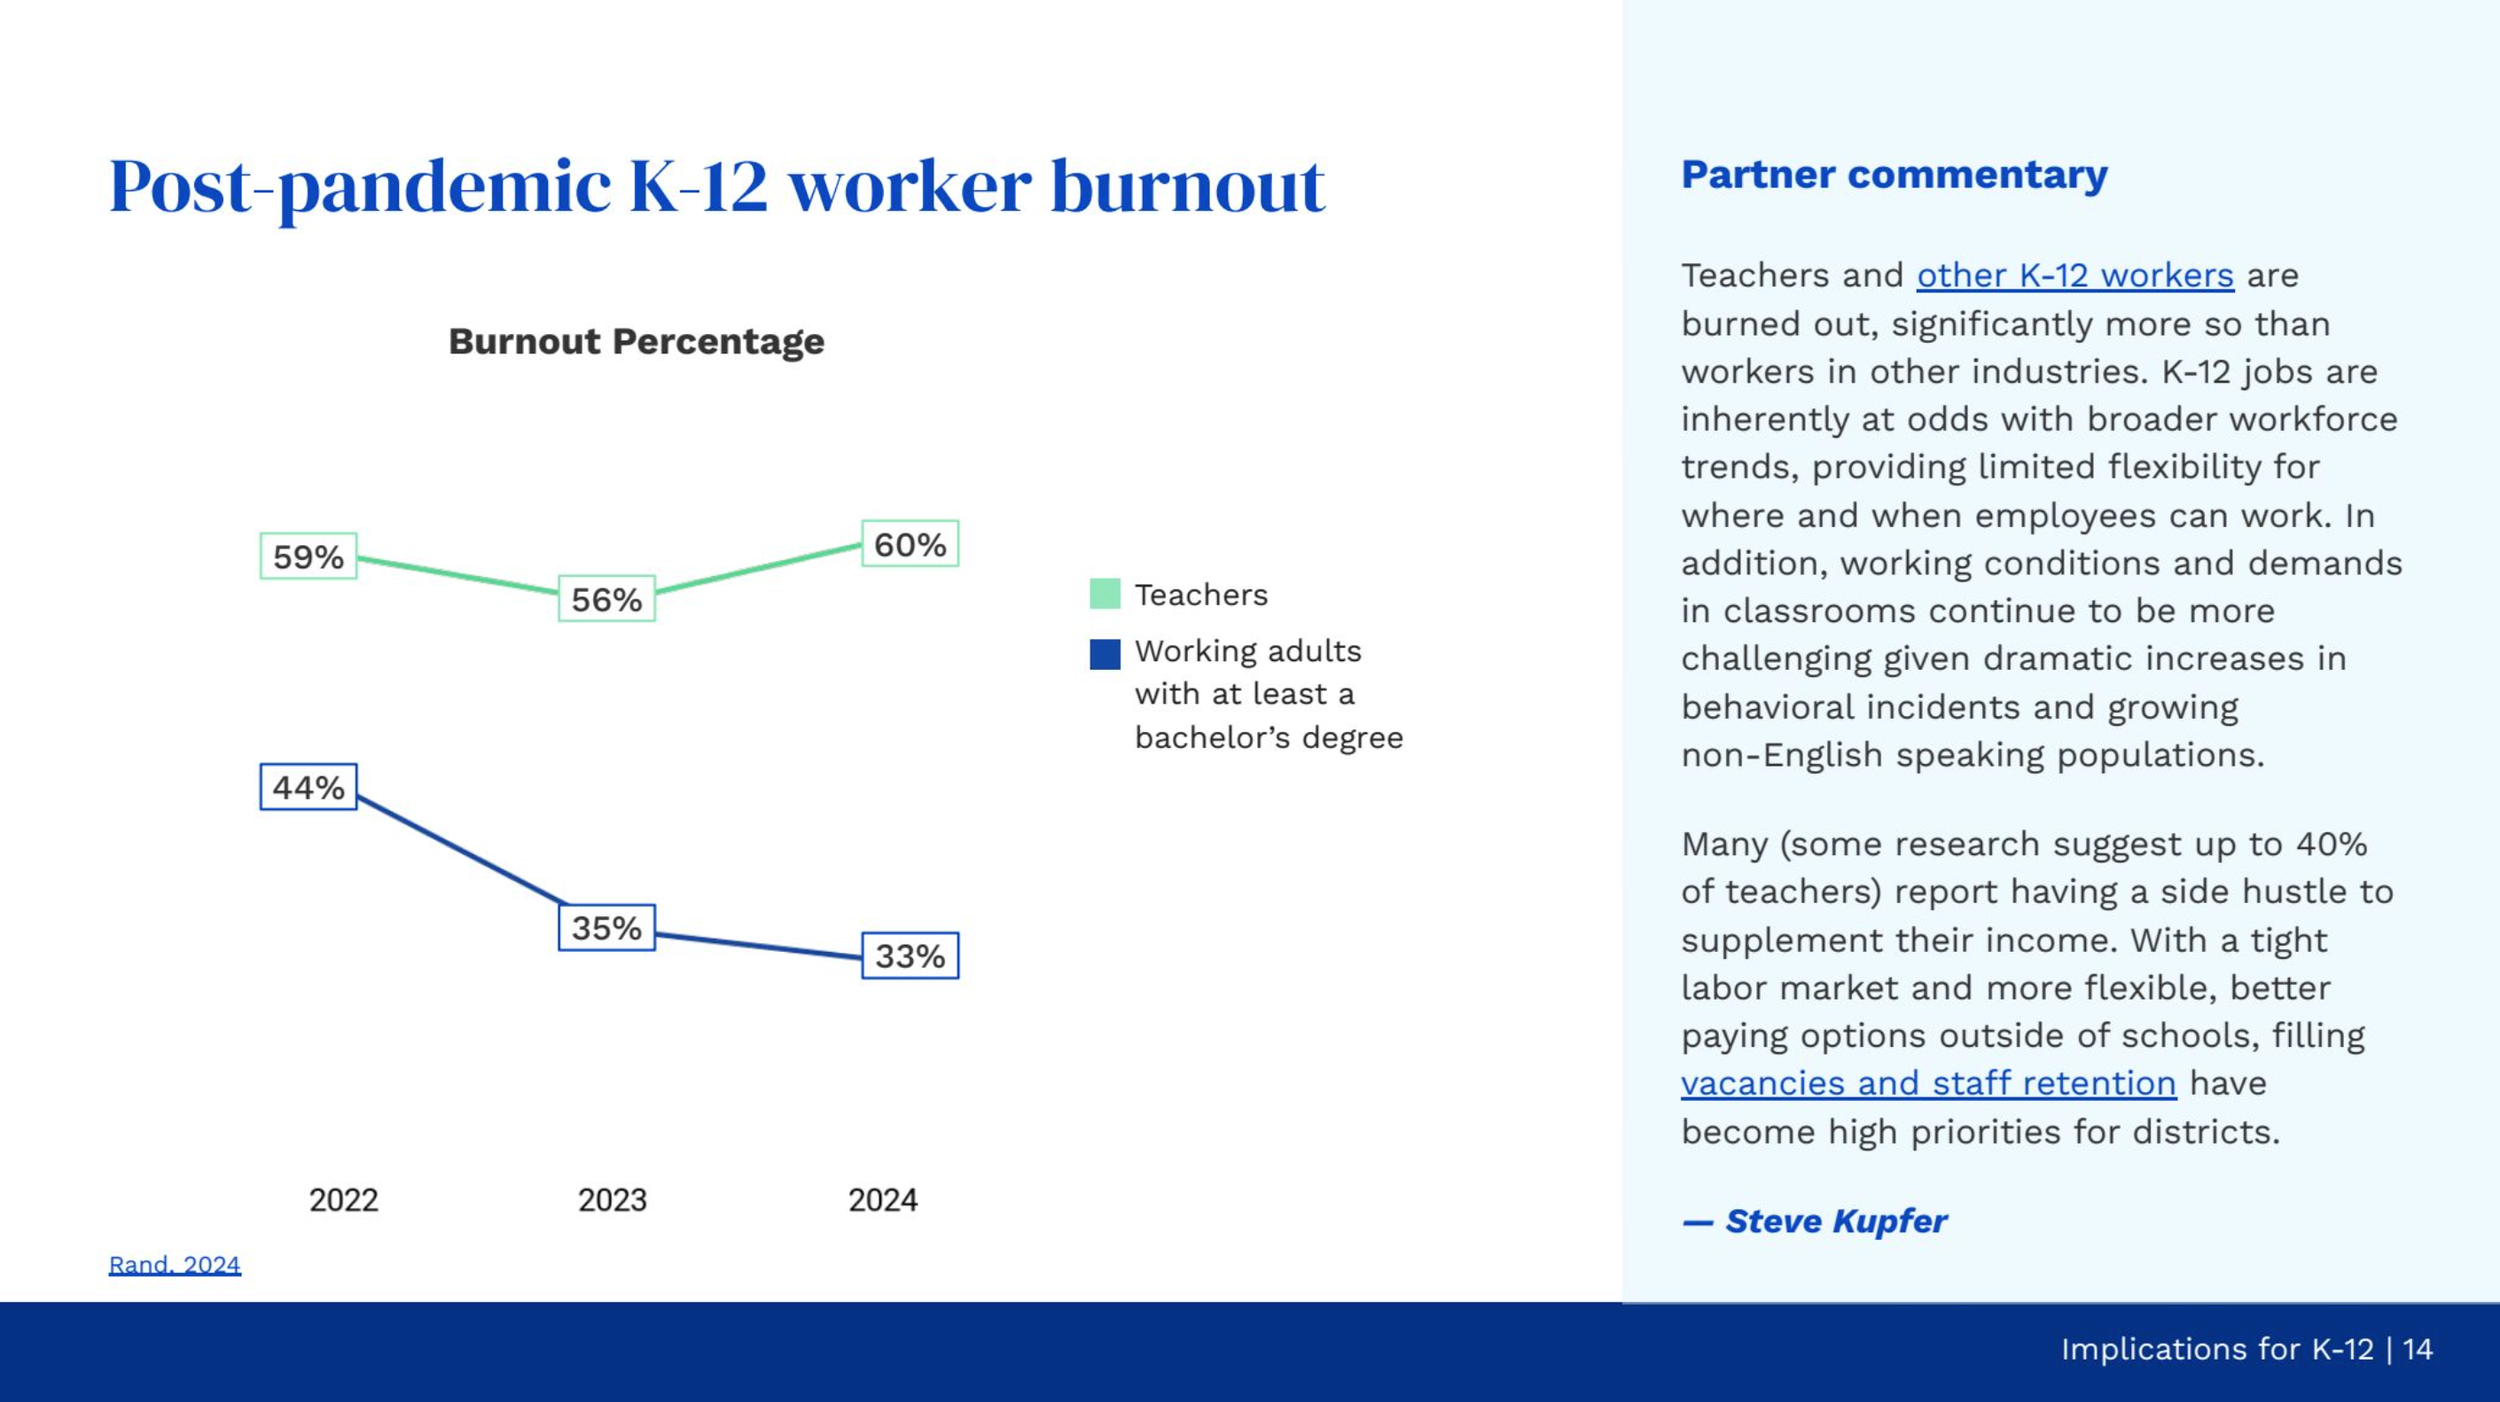
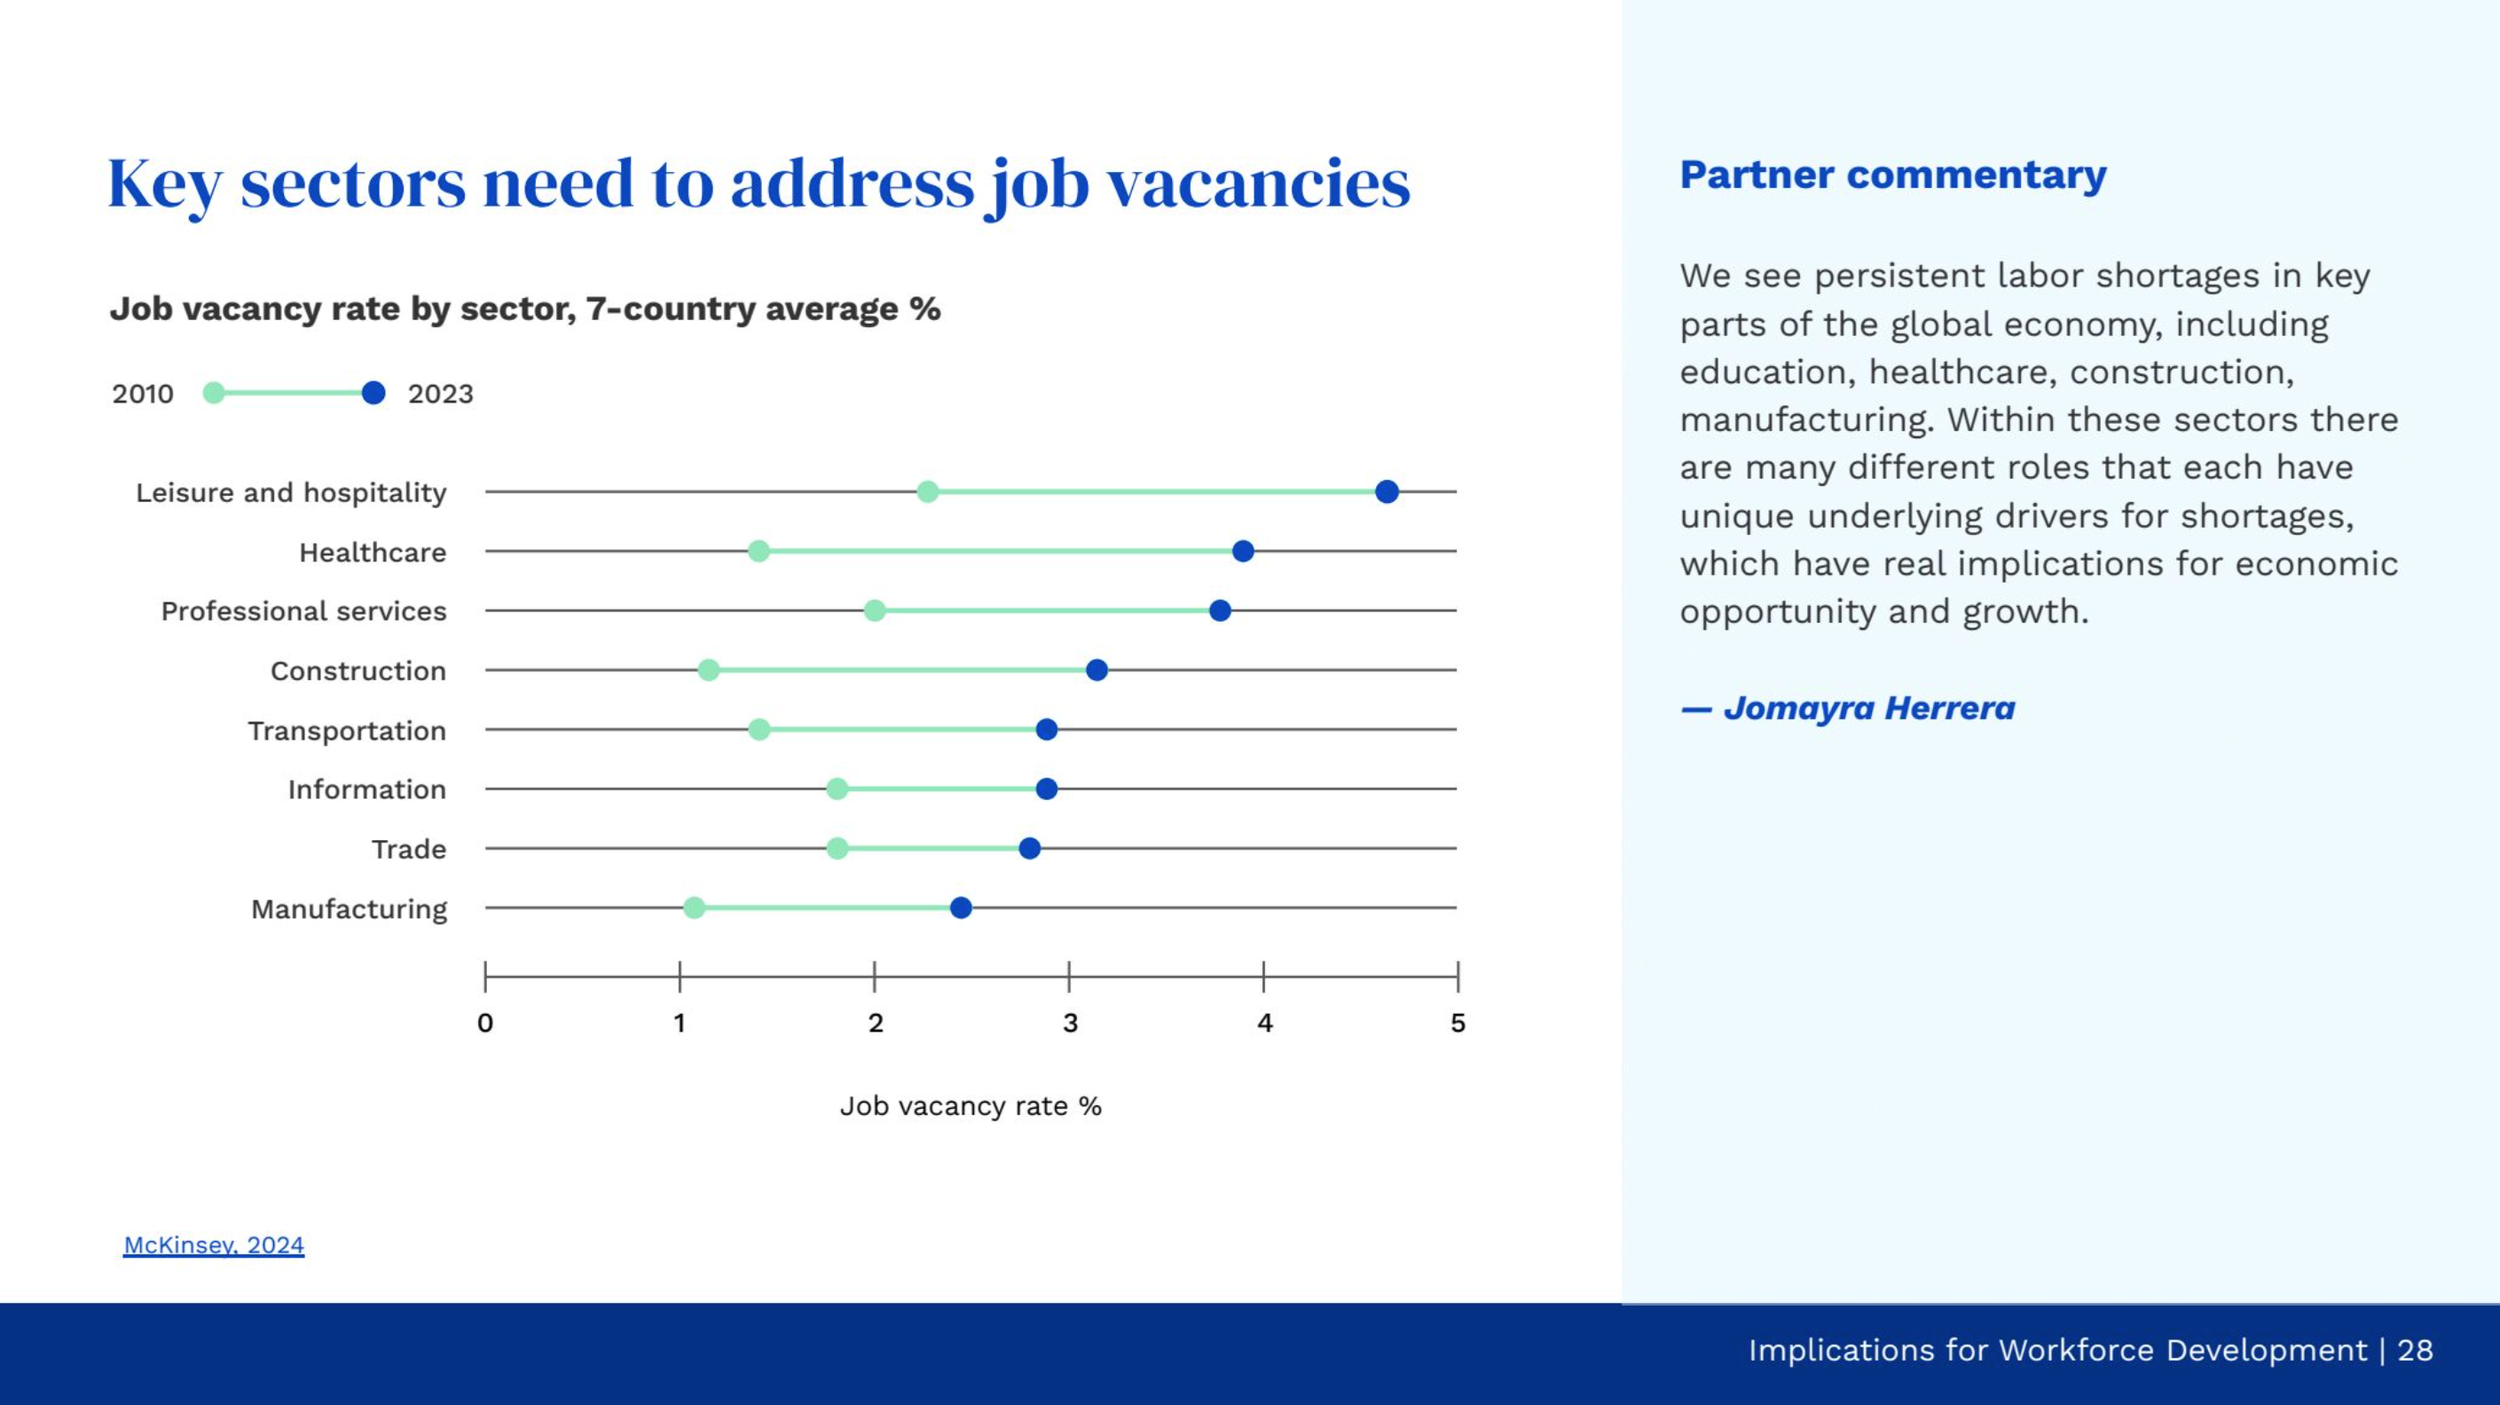
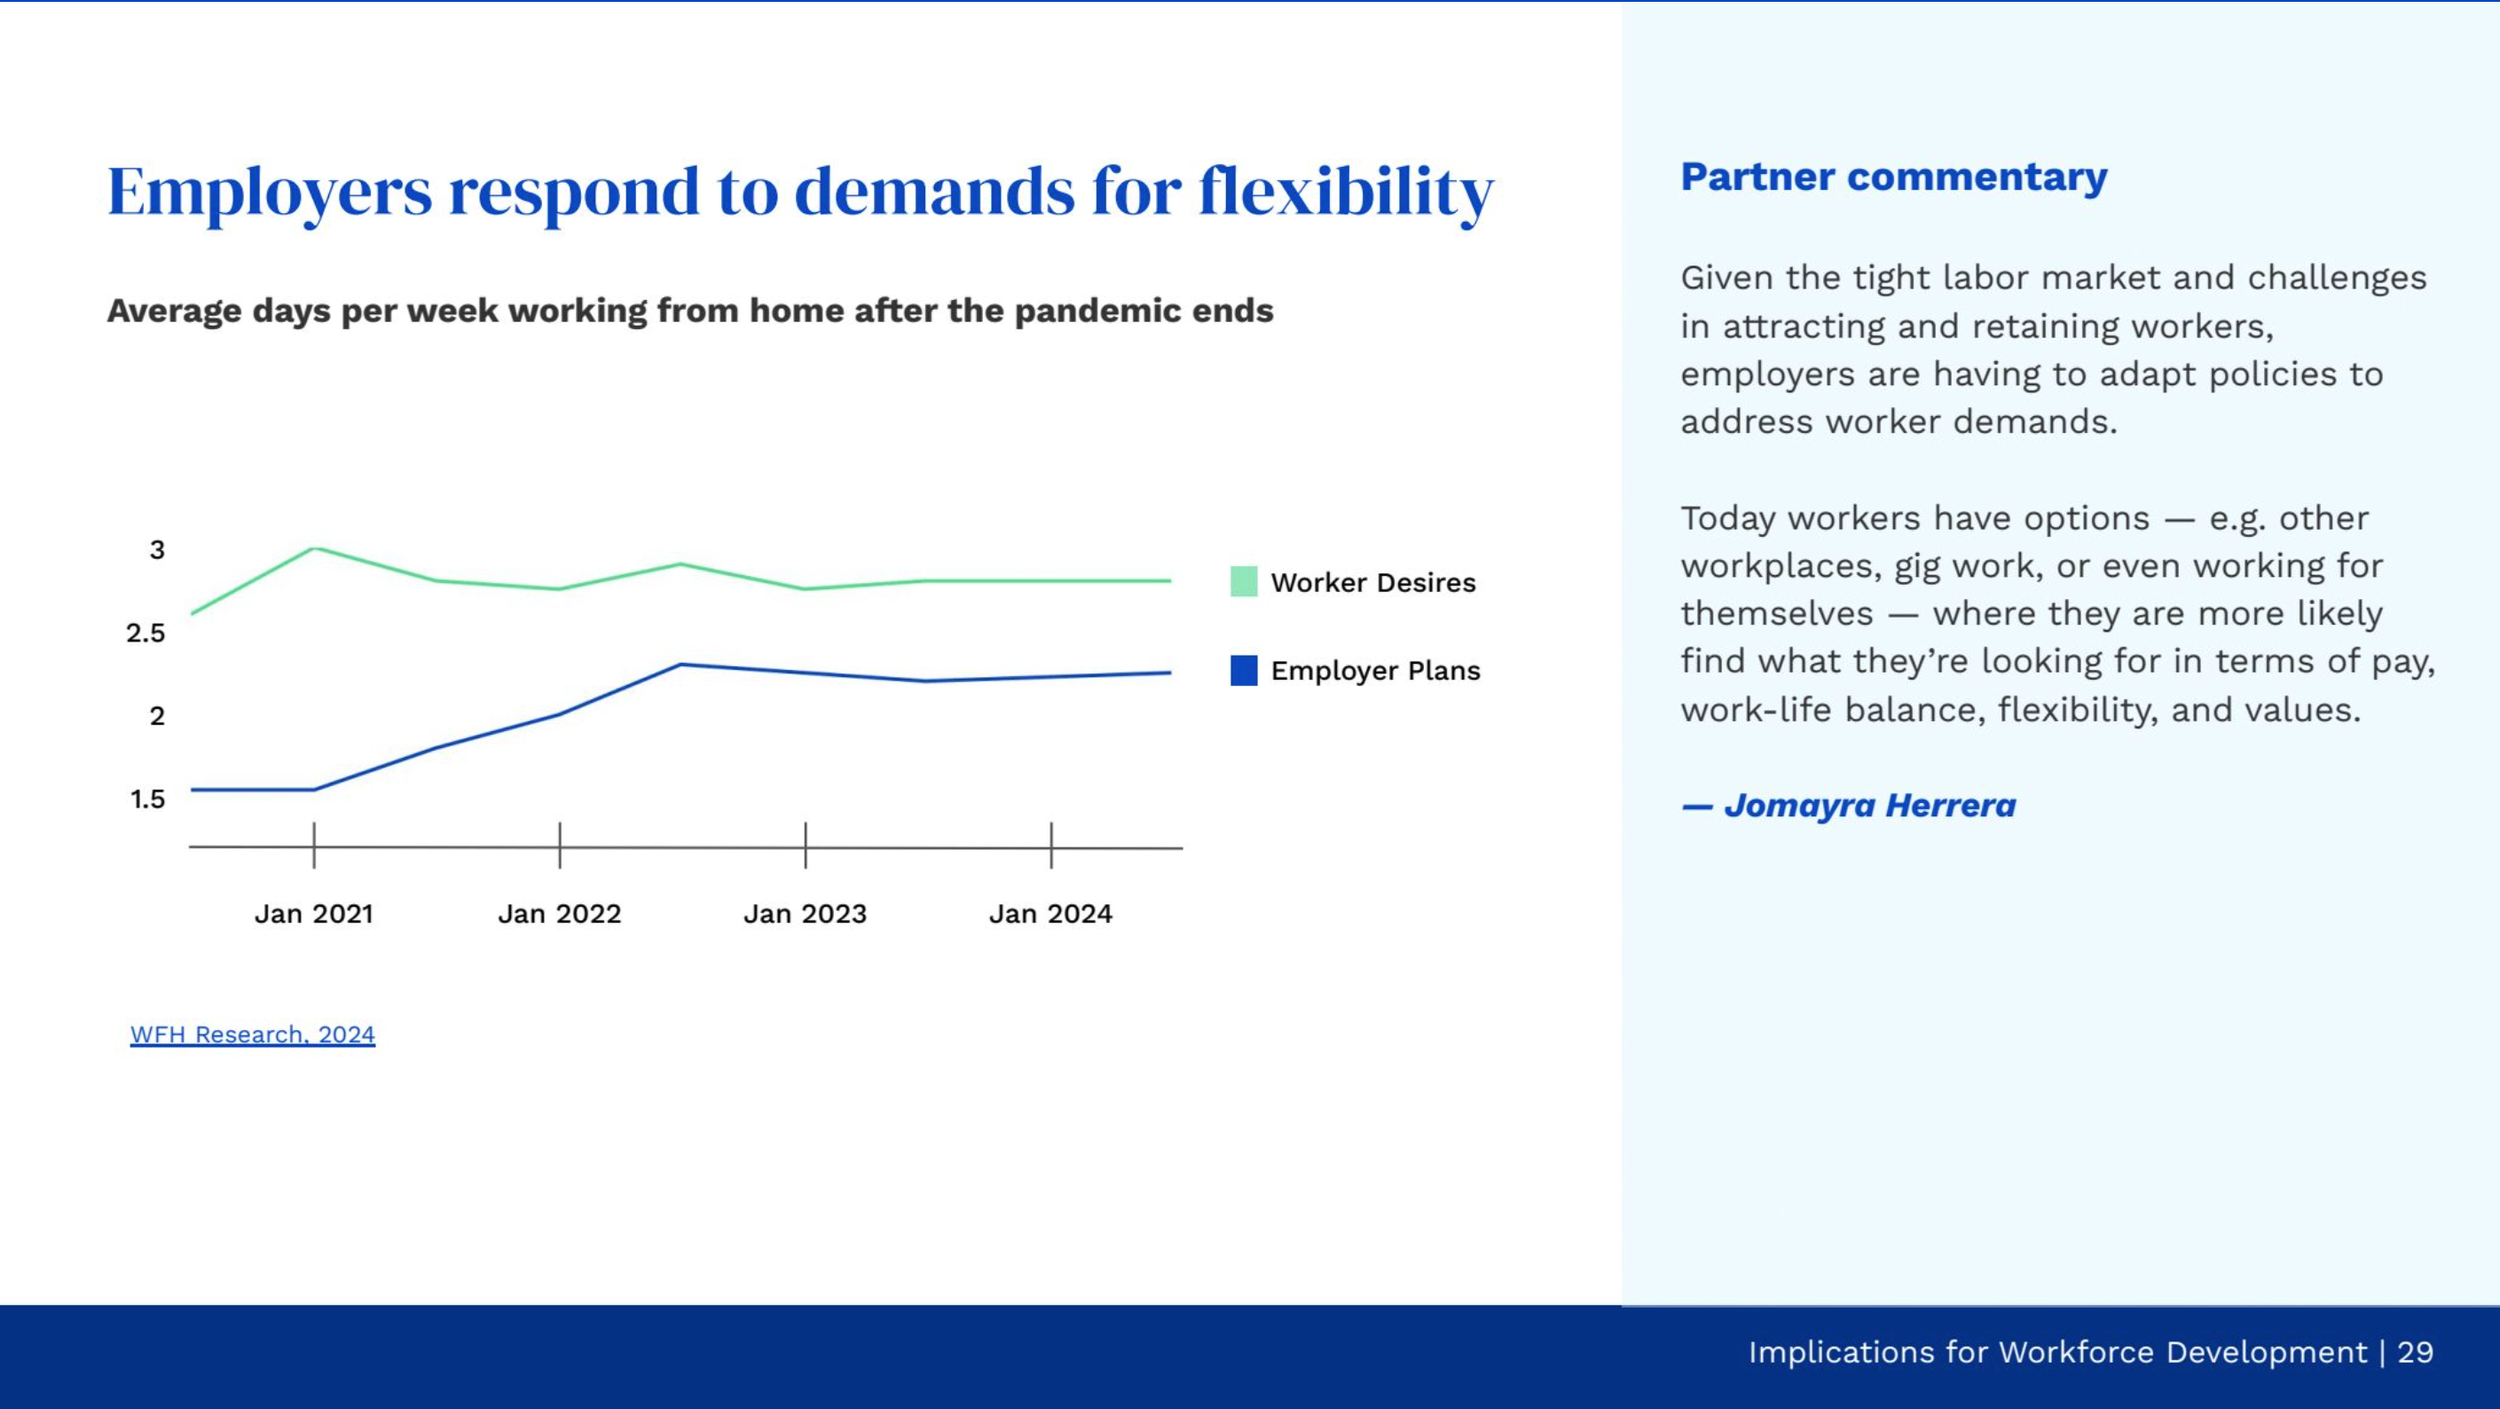
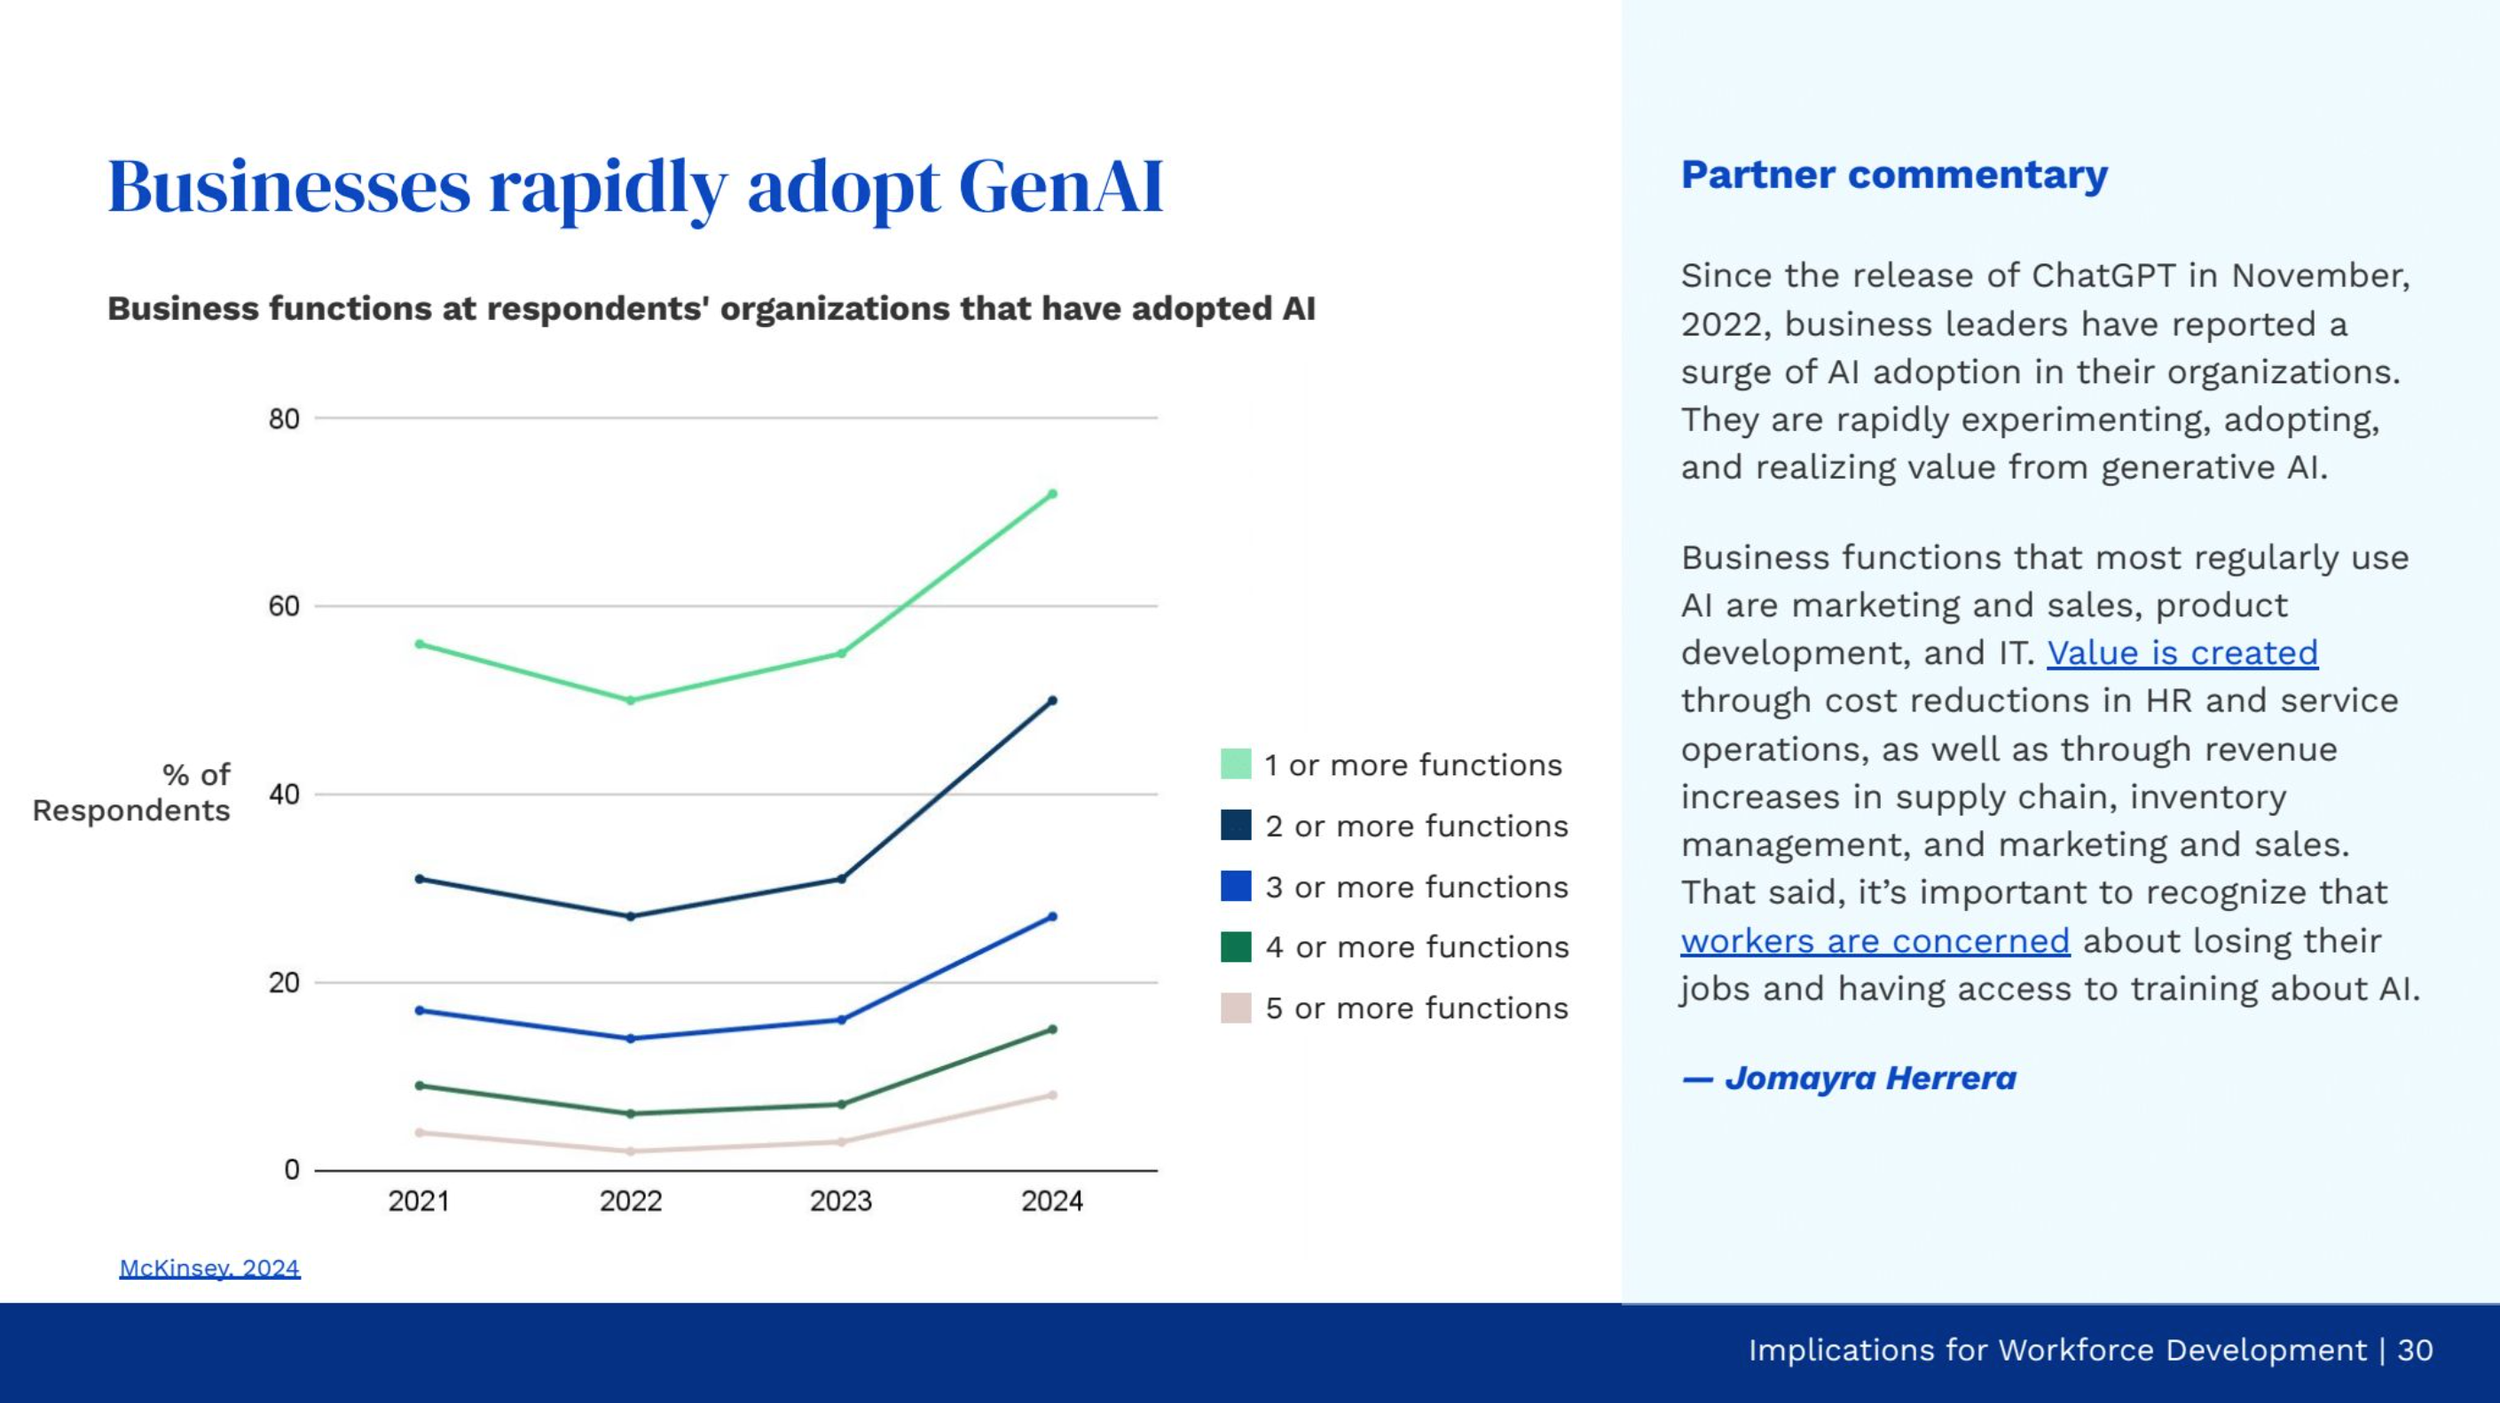
Through a unified data visualization system, I transformed research on labor shortages, worker priorities, and generative AI adoption into clear, digestible graphics.
Using consistent chart styles, accessible color palettes, and paired partner commentary, the slides connect shifting workforce dynamics with Reach Capital’s investment thesis, giving investors both the numbers and the narrative behind emerging trends.
Where Numbers Meet Human Stories
I designed company profiles that paired impact metrics with real user stories, combining data visualization with human-centered narratives to show how Reach Capital’s investments directly improve lives and create measurable change.